Tag

Dips

Browsing


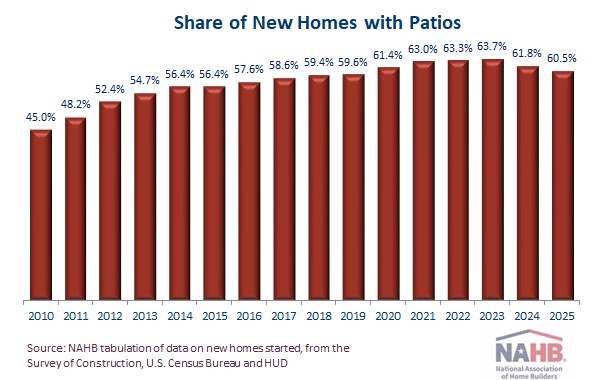
The share of new homes with patios dipped below 61% for the first time since 2019, according to NAHB tabulation of data from the Survey of Construction (conducted by the U.S. Census Bureau with partial funding from the Department of Housing and Urban Development). Of the roughly 940,00 single-family homes started during 2025, 60.5% came with patios. This is down from 61.8% in 2024 and marks the lowest percentage since the 59.6% recorded in 2019.

Historically, the share of homes with patios was increasing every year from the end of the Great Recession through 2023 (except in 2015, when it was unchanged). Over the past two years, however, the trend reversed itself, and the share of new homes with patios has started to decline.

Historically, the share of homes with patios was increasing every year from the end of the Great Recession through 2023 (except in 2015, when it was unchanged). Over the past two years, however, the trend reversed itself, and the share of new homes with patios has started to decline. During that time, the geographic pattern of patios on new homes has remained stable for the most part, but in 2025 the share of new homes with patios increased substantially—from 14% in 2024 to 26%—in New England. New England has traditionally been the Census division where patios on new homes are least common, but in 2025 New England edged ahead of the Middle Atlantic, where the percentage held steady at 23%.  At the high end, the top three divisions for new-home patios remained the same in 2025 as they had been the previous year: the West South Central (77%), Mountain Division (74%), and South Atlantic (66%).

Additional detail on the characteristics of new-home patios is available from the Annual Builder Practices Survey (BPS) conducted by Home Innovation Research Labs.

For the U.S. as a whole, the 2026 BPS report (based on homes built in 2025 like the SOC-based statistics cited above) shows that the average size of a new-home patio is about 320 square feet, but with considerable geographic variation. The average is well over 400 square feet in the adjacent East North Central and East South Central divisions. New home patios are considerably smaller on the other side of the Mississippi River, with an average of under 200 square feet in the West South Central, and only a little over 200 square feet in the West North Central division.

In most parts of the country, builders use more poured concrete than any other material in new home patios. Across all nine Census divisions, poured concrete accounts for over 60% of new home patios on a square-foot basis. The only real counterexample continues to be the New England division, where concrete pavers and natural stone each account for more patio square footage than poured concrete, and brick pavers account for almost as much.


This article was originally published by a eyeonhousing.org . Read the Original article here. .


Housing’s share of the economy was 15.9% in the first quarter of 2026, according to the latest estimates of GDP produced by the Bureau of Economic Analysis. This share is down from 16.0% in the fourth quarter and is lower than 16.5% registered just one year ago. Residential construction, measured by residential fixed investment, fell at its fastest pace in over three years, while household expenditures on housing services continued to remain steady.

The more cyclical home building and remodeling component–residential fixed investment (RFI)–was 3.7% of GDP, down from 3.8% in the previous quarter. The second component, housing services, was 12.2% of GDP, down from 12.3% in the previous quarter. The graph below plots the share for housing services and RFI, along with housing’s total share of nominal GDP.

Housing service expenditures are much less volatile when compared to RFI due to the cyclical nature of RFI. Historically, RFI has averaged roughly 5% of GDP, while housing services have averaged between 12% and 13%, for a combined 17% to 18% of GDP. These shares tend to vary over the business cycle. However, the housing share of GDP lagged during the post-Great Recession period due to underbuilding, particularly in the single-family sector.

Residential Fixed Investment

In the first quarter, RFI subtracted 31 basis points from the headline GDP growth rate, marking the fifth consecutive quarter of negative contributions. This was the largest negative contribution since the fourth quarter of 2022. RFI was 3.7% of the economy, recording a $1.2 trillion seasonally adjusted annual pace. Among the two segments of RFI, private investment in structures fell 8.2%, while residential equipment rose 6.7%.

Breaking down the components of residential structures, single-family RFI fell 8.2%, while multifamily RFI rose 1.9%. This marks the second consecutive increase in RFI for multifamily structures, as the estimate in the fourth quarter of 2025 was revised to 1.7%, up from a decline of 3.6%. Permanent site structure RFI, which is made up of single-family and multifamily RFI, fell 5.9%. The “other structures” RFI category fell significantly, down 10.1% in the first quarter. This component consists primarily of manufactured homes, improvements, and dormitories. On a seasonally adjusted annual basis in the first quarter, private investment in permanent site structures was at $521.4 billion, while other structures totaled $627.9 billion.

Housing Services

The second impact of housing on GDP is the measure of housing services. Similar to the RFI, housing services consumption can be broken into two components. The first component, housing, includes gross rents paid by renters, owners’ imputed rent (an estimate of how much it would cost to rent owner-occupied units), rental value of farm dwellings, and group housing. The inclusion of owners’ imputed rent is necessary from a national income accounting approach, because without this measure, increases in homeownership would result in declines in GDP. The second component, household utilities, is composed of consumption expenditures on water supply, sanitation, electricity, and gas.

For the first quarter, housing services represented 12.2% of the economy or $3.9 trillion on a seasonally adjusted annual basis. Real housing services expenditure rose 1.3% at an annual rate in the fourth quarter. Real personal consumption expenditures for housing grew 1.2%, while real household utilities expenditures increased 1.6%.

Personal consumption expenditure (PCE) on housing services is the largest component of PCE, making up 18.0% in the first quarter. The second largest component of PCE is health care services, at 17.2%. Expenditure on services was $15.0 trillion on a seasonally adjusted annual basis in the fourth quarter, more than double the expenditure on goods ($6.7 trillion).


This article was originally published by a eyeonhousing.org . Read the Original article here. .
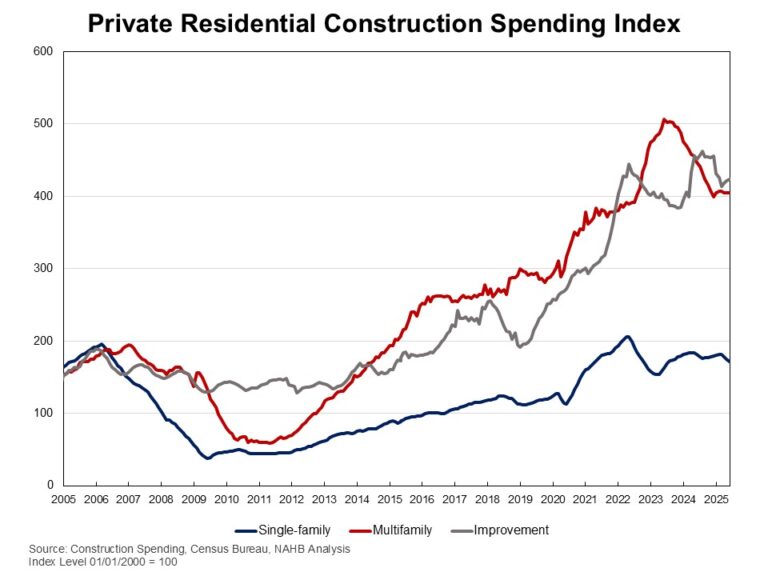

Private residential construction spending fell by 0.7% in June, marking the sixth straight month of decreases. This decline was primarily driven by reduced spending on single-family construction. Compared to a year ago, total spending was down 6.2%, as the housing sector continues to navigate the economic uncertainty stemming from ongoing tariff concerns and elevated mortgage rates. 

According to the latest U.S. Census Construction Spending data, single-family construction spending declined by 1.8% in June. This decrease aligns with the weak single-family starts in June and the third lowest reading of NAHB/Wells Fargo Housing Market Index (HMI) since 2012. Compared to a year ago, single-family construction spending decreased by 5.3%. Meanwhile, multifamily construction spending stayed flat for the month but continued to follow the downward trend that began in mid-2023. Compared to June 2024, multifamily spending was down 9.5%. Improvement spending (remodeling) was up 0.5% in June but was 6.1% lower on a year-over-year basis.  

The NAHB construction spending index is shown in the graph below. The index illustrates how   spending on single-family construction has slowed since early 2024 under the pressure of elevated interest rates and concerns over building material tariffs. Multifamily construction spending growth has also slowed down after the peak in July 2023. Additionally, improvement spending has been weakening since the beginning of 2025.


Meanwhile, spending on private nonresidential construction was down 4% over a year ago. The annual private nonresidential spending decrease was primarily driven by a $14.7 billion drop in the manufacturing category, followed by a $13.7 billion decrease in commercial construction spending.

Discover more from Eye On Housing

Subscribe to get the latest posts sent to your email.


This article was originally published by a eyeonhousing.org . Read the Original article here. .


In the second quarter of 2025, the NAHB/Westlake Royal Remodeling Market Index (RMI) posted a reading of 59, down four points compared to the previous quarter. While this reading is still in positive territory, some remodelers, especially in the West, are seeing a slowing of activity in their markets. The second-quarter reading of 59 marks only the second time the RMI has dipped below 60 since the survey was revised in the first quarter of 2020.

Higher interest rates and general economic uncertainty have affected consumer confidence and are headwinds for remodeling, but not to the extent that they have been for single-family construction, as is evident in June’s negative reading from the NAHB/Wells Fargo Housing Marketing Index (HMI).  As a result, NAHB is still forecasting solid gains for remodeling spending in 2025, followed by more modest, but still positive, growth in 2026. 

The RMI is based on a survey that asks remodelers to rate various aspects of the residential remodeling market “good”, “fair” or “poor.”  Responses from each question are converted to an index that lies on a scale from 0 to 100. An index number above 50 indicates a higher proportion of respondents view conditions as good rather than poor.

Current Conditions

The Remodeling Market Index (RMI) is an average of two major component indices: the Current Conditions Index and the Future Indicators Index. 

The Current Conditions Index is an average of three subcomponents: the current market for large remodeling projects ($50,000 or more), moderately sized projects ($20,000 to $49,999), and small projects (under $20,000).  In the second quarter of 2025, the Current Conditions Index averaged 66, down five points from the previous quarter.  All three components decreased quarter-over-quarter, with both small and moderately-sized remodeling projects falling six points to 70 and 66, respectively, while large remodeling projects slipped two points to 62.  Nevertheless, all three components remained above 50 in positive territory.

Future Indicators

The Future Indicators Index is an average of two subcomponents: the current rate at which leads and inquiries are coming in, and the current backlog of remodeling projects. 

In the second quarter of 2025, the Future Indicators Index averaged 51, decreasing four points from the previous quarter. While the component measuring the current rate at which leads and inquiries are coming in remained unchanged at 51, the component measuring the backlog of remodeling jobs fell six points to 52.  Similar to the Current Conditions components, both remain above 50 in positive territory.

For the full set of RMI tables, including regional indices and a complete history for each RMI component, please visit NAHB’s RMI web page.

Discover more from Eye On Housing

Subscribe to get the latest posts sent to your email.


This article was originally published by a eyeonhousing.org . Read the Original article here. .


Private residential construction spending fell by 0.5% in May, marking the fifth straight month of decreases. This drop was primarily driven by reduced spending on single-family construction. Compared to a year ago, total spending was down 6.7%, as the housing sector continues to navigate the economic uncertainty stemming from ongoing tariff concerns and elevated mortgage rates.

According to the latest U.S. Census Construction Spending data, single-family construction spending declined by 1.8% in May. This decrease aligns with the third lowest reading of NAHB/Wells Fargo Housing Market Index (HMI) since 2012. Compared to a year ago, single-family construction spending decreased by 4.5%. Meanwhile, multifamily construction spending stayed flat for the month but continued to follow the downward trend that began in mid-2023. Compared to May 2024, multifamily spending was down 10.9%. Improvement spending (remodeling) was up 0.9% in May but was 7.8% lower on a year-over-year basis.

The NAHB construction spending index is shown in the graph below. The index illustrates how   spending on single-family construction has slowed since early 2024 under the pressure of elevated interest rates and concerns over building material tariffs. Multifamily construction spending growth has also slowed down after the peak in July 2023. Improvement spending has also been weakening since the beginning of 2025.

Spending on private nonresidential construction was down 3.9% over a year ago. The annual private nonresidential spending decrease was primarily driven by a $15 billion drop in commercial construction spending, followed by a $9.0 billion decrease in the manufacturing category.

Discover more from Eye On Housing

Subscribe to get the latest posts sent to your email.


This article was originally published by a eyeonhousing.org . Read the Original article here. .
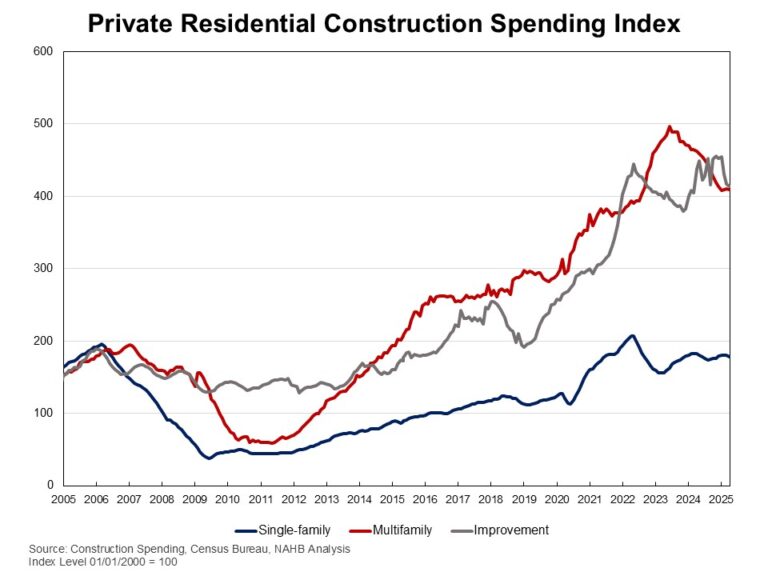

Private residential construction spending fell by 0.9% in April, marking the third consecutive monthly decline. This decrease was primarily driven by reduced spending in single-family construction and home improvements. Compared to a year ago, total spending was down 4.8%, as the housing sector continues to navigate the economic uncertainty stemming from ongoing tariff concerns and elevated mortgage rates.

According to the latest U.S. Census Construction Spending data, single-family construction spending declined by 1.1% in April. This decrease aligns with the weakness in the April single-family starts and NAHB/Wells Fargo Housing Market Index (HMI). The April data ends seven months of growth in single-family construction spending, making it 2.2% lower than a year ago. Meanwhile improvement spending was down 0.8% in April and was 5.5% lower on a year-over-year basis. Multifamily construction spending edged down 0.1% in April, staying in the downward trend that began in December 2023. Compared to April 2024, multifamily spending was down 11.3%.

The NAHB construction spending index is shown in the graph below. The index illustrates how   spending on single-family construction has slowed since early 2024 under the pressure of elevated interest rates and concerns over building material tariffs. Multifamily construction spending growth has also slowed down after the peak in July 2023. Improvement spending has also been weakening since the beginning of 2025.

Spending on private nonresidential construction was up 1% over a year ago. The annual private nonresidential spending increase was mainly due to higher spending for the class of power ($7.9 billion), followed by the office category ($3.3 billion).

Discover more from Eye On Housing

Subscribe to get the latest posts sent to your email.


This article was originally published by a eyeonhousing.org . Read the Original article here. .
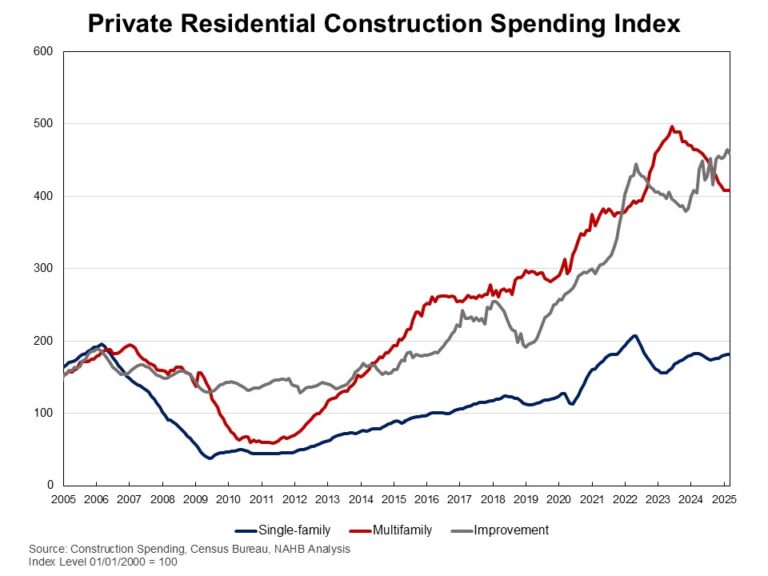

Private residential construction spending declined by 0.4% in March, largely driven by a decrease in home improvement spending. This decline followed five consecutive months of growth. Despite the monthly drop, spending remained 2.8% higher than a year ago, showing the resilience of the housing market.

According to the latest U.S Census Construction Spending data, improvement spending declined by 1.2% in March, aligned with the weakness in the Remodeling Market Sentiment of the first quarter of 2025. Still, spending on improvements was 13.4% higher than in March of 2024. Meanwhile, spending on single-family construction edged up by 0.1% in March, continuing its growth after a five-month decline from April to August 2024. However, single-family construction spending remained 0.8% lower than a year ago. Multifamily construction spending stayed unchanged in March, staying in the downward trends that began in December 2023. Compared to March 2024, it was down 12.1%.

The NAHB construction spending index is shown in the graph below. The index illustrates how   spending on single-family construction has slowed since early 2024 under the pressure of elevated interest rates and concerns over building material tariffs. Multifamily construction spending growth has also slowed down after the peak in July 2023. Meanwhile, improvement spending has increased its pace since late 2023.

Spending on private nonresidential construction was up 1.6% over a year ago. The annual private nonresidential spending increase was mainly due to higher spending for the class of power ($8.7 billion), followed by the manufacturing category ($8.1 billion).

Discover more from Eye On Housing

Subscribe to get the latest posts sent to your email.


This article was originally published by a eyeonhousing.org . Read the Original article here. .
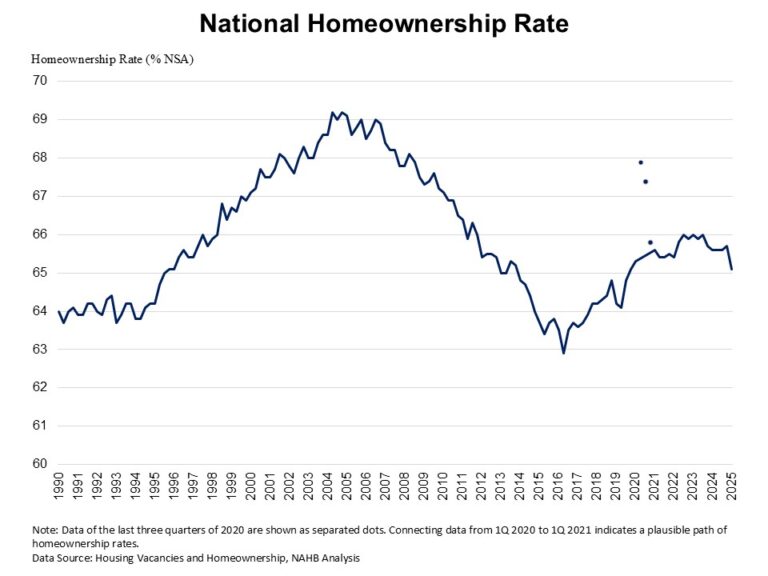

The homeownership rate declined to 65.1% in the first quarter of 2024, the lowest level since the first quarter of 2020, according to the Census’s Housing Vacancy Survey (HVS). Amid elevated mortgage interest rates and tight housing supply, housing affordability is at a multidecade low. Compared to the peak of 69.2% in 2004, the homeownership rate is 4.1 percentage points lower and remains below the 25-year average rate of 66.3%.

Homeownership rates declined across nearly all age groups over the past year, except those aged 65 and older. Among younger households, the homeownership rate for those under 35 rose slightly to 36.6% in the first quarter of 2024. However, it is still hovering at the lowest rate in the last 6 years. This age group, particularly sensitive to mortgage rates and the inventory of entry-level homes, saw the largest decline among all age categories (1.1 percentage points down). Similar declines were seen among the 35-44 group and 55-64 age group, with rates decreasing from 61.4% to 60.3% and from 76.3% to 75.2%, respectively. Homeownership rates for householders aged 45-54 dipped slightly from 70.8% to 70.6%. In contrast, those 65 years and over experienced a modest increase from 78.7% to 79%.

The national rental vacancy rate increased to 7.1% for the first quarter of 2025, returning to the pre-pandemic levels after several years of tight rental market. Meanwhile, the homeowner vacancy rate stayed at 1.1%, remaining near the survey’s 67-year low of 0.7%.

The housing stock-based HVS revealed that the count of total households increased to 132.2 million in the first quarter of 2025 from 131.0 million a year ago. The gains are due to gains in both renter household formation (1.2 million increase), and owner-occupied households (106,000 increase).

Discover more from Eye On Housing

Subscribe to get the latest posts sent to your email.


This article was originally published by a eyeonhousing.org . Read the Original article here. .
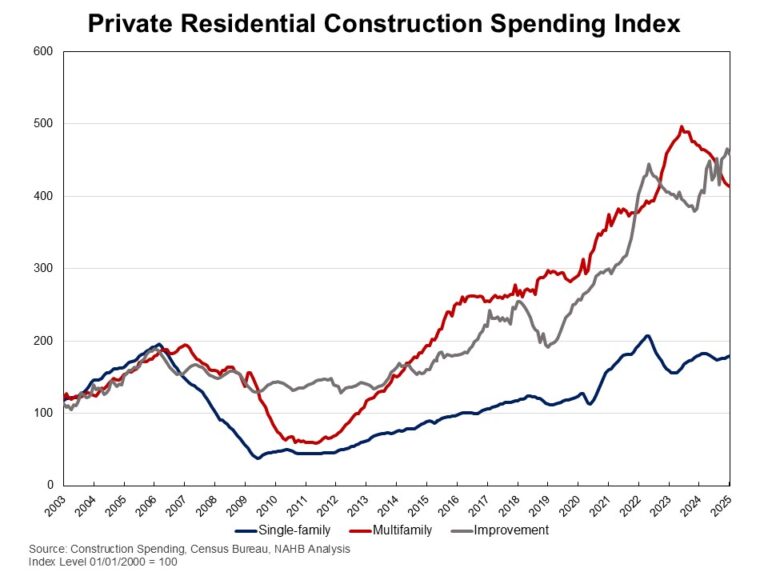

Private residential construction spending declined by 0.4% in January, largely driven by a decrease in multifamily construction and home improvement spending. This decline followed three consecutive months of growth, indicating a downward shift in the monthly data.  Despite the monthly drop, spending remains 3.1% higher than a year ago, showing the resilience of the housing market.

  According to the latest U.S Census Construction Spending data, multifamily construction spending fell by 0.7% for the month, extending the downward trends that began in December 2023. This decline aligns with the weakness in the Multifamily Production Index (MPI) and a lower number of multifamily homes under construction. Improvement spending declined by 1.5% in January but was 14.3% higher compared to the same period last year. Meanwhile, spending on single-family construction rose by 0.6% in January, continuing its growth after a  five-month decline from April to August. This growth also aligns with steady builder confidence seen in the Housing Market Index. However, single-family construction remained 0.9% lower than a year ago.

The NAHB construction spending index is shown in the graph below. The index illustrates how   spending on single-family construction has slowed since early 2024 under the pressure of elevated interest rates and concerns over building material tariffs. Multifamily construction spending growth has also slowed down after the peak in July 2023. Meanwhile, improvement spending has increased its pace since late 2023.

Spending on private nonresidential construction was up 1.8% over a year ago. The annual private nonresidential spending increase was mainly due to higher spending for the class of manufacturing ($12.4 billion), followed by the power category ($5.5 billion).

Discover more from Eye On Housing

Subscribe to get the latest posts sent to your email.


This article was originally published by a eyeonhousing.org . Read the Original article here. .
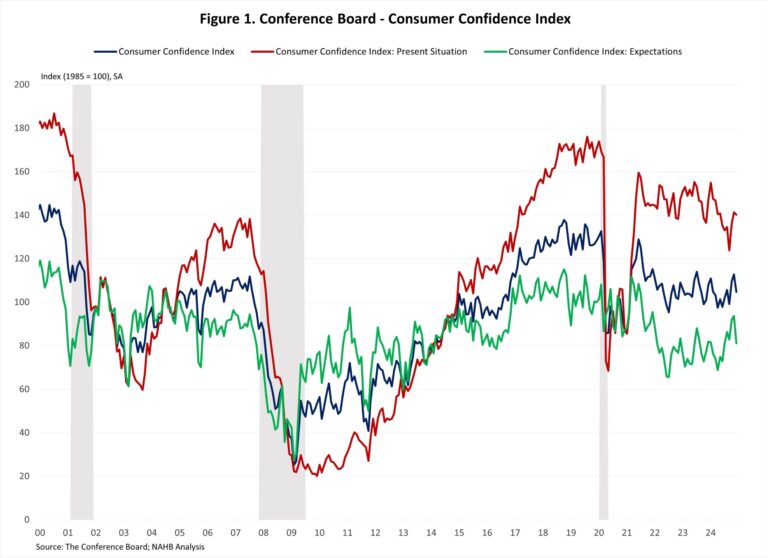

Consumer confidence fell to a three-month low in December amid growing concerns about economic uncertainties, especially potential tariffs. These policy changes could derail inflation progress and lead the Fed to slow its easing pace.

The Consumer Confidence Index, reported by the Conference Board, is a survey measuring how optimistic or pessimistic consumers feel about their financial situation. This index fell from 112.8 to 104.7 in December, the largest monthly decline since August 2021. The Consumer Confidence Index consists of two components: how consumers feel about their present situation and about their expected situation. The Present Situation Index decreased 1.2 points from 141.4 to 140.2, and the Expectation Situation Index dropped 12.6 points from 93.7 to 81.1, just above the 80 threshold. Historically, an Expectation Index reading below 80 often signals a recession within a year.

Consumers’ assessment of current business conditions turned negative in December. The share of respondents rating business conditions “good” decreased by 2.5 percentage points to 19.1%, while those claiming business conditions as “bad” rose by 1.4 percentage points to 16.7%. However, consumers’ assessments of the labor market improved. The share of respondents reporting that jobs were “plentiful” rose by 3.4 percentage points to 37%, and those who saw jobs as “hard to get” decreased by 0.4 percentage points to 14.8%.

Consumers were less optimistic about the short-term outlook. The share of respondents expecting business conditions to improve fell from 24.7% to 21.7%, while those expecting business conditions to deteriorate rose from 15.9% to 18.3%. Similarly, expectations of employment over the next six months were less positive. The share of respondents expecting “more jobs” decreased by 3.7 percentage points to 19.1%, and those anticipating “fewer jobs” climbed by 3.4 percentage points to 21.3%.

The Conference Board also reported the share of respondents planning to buy a home within six months. The share of respondents planning to buy a home fell to 4.9% in December. Of those, respondents planning to buy a newly constructed home decreased to 0.4%, and those planning to buy an existing home dropped to 2.2%.

Discover more from Eye On Housing

Subscribe to get the latest posts sent to your email.


This article was originally published by a eyeonhousing.org . Read the Original article here. .

Pin It