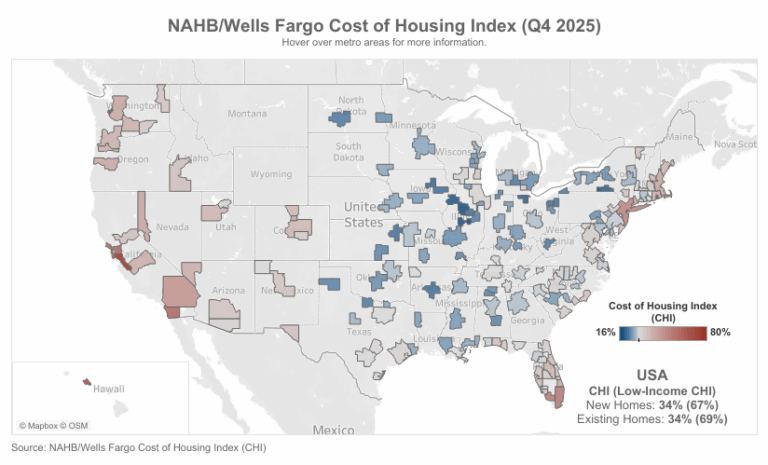
Though new and existing homes remain largely unaffordable, the needle moved slightly in the right direction in the second half of 2025, according to the latest data from the National Association of Home Builders (NAHB)/Wells Fargo Cost of Housing Index (CHI). The CHI results from the fourth quarter of 2025 show that a family earning the nation’s median income of $104,200 needed 34% of its income to cover the mortgage payment on a median-priced new home. Low-income families, defined as those earning only 50% of median income, would have to spend 67% of their earnings to pay for the same new home.
In the last three quarters of 2025, the income share needed to buy a new home declined from 36% in the second quarter, to 35% in the third quarter and 34% in the final quarter of 2025. These figures indicate a slight improvement in affordability.
The same trend holds true for existing homes. A typical family would have to pay 37% of their income for a median-priced existing home in the second quarter, 36% in the third quarter and 34% in the final three months of 2025. A low-income family would need to pay 69% of their earnings to make the same mortgage payment on an existing home in the fourth quarter.
The U.S. data for the percentage of earnings needed to purchase a new home in the fourth quarter is based on a national median new home price of $405,300 and median income of $104,200. The fourth quarter median new home price is down 1.2% from $410,100 in the third quarter. The corresponding price for an existing home in the fourth quarter fell to $414,900, 2.8% down from $426,800 in the previous quarter. The average 30-year mortgage rate moved lower from 6.65% in the third quarter to 6.32% in the fourth quarter.
CHI is also available for 175 metropolitan areas, calculating the percentage of a family’s income needed to make the mortgage payment on an existing home based on the local median home price and median income in those markets.
In eight out of 175 markets in the fourth quarter, the typical family is severely cost-burdened (must pay more than 50% of their income on a median-priced existing home). In 69 other markets, such families are cost-burdened (need to pay between 31% and 50%). There are 98 markets where the CHI is 30% of earnings or lower.
The Top 5 Severely Cost-Burdened Markets
San Jose-Sunnyvale-Santa Clara, Calif., was the most severely cost-burdened market in the CHI, where 80% of a typical family’s income is needed to make a mortgage payment on an existing home. This was followed by:
Urban Honolulu, Hawaii (69%)
San Francisco-Oakland-Fremont, Calif. (63%)
San Diego-Chula Vista-Carlsbad, Calif. (62%)
Barnstable Town, Mass. (56%)
Miami-Fort Lauderdale-West Palm Beach, Fla. (56%)
Naples-Marco Island, Fla. (56%)
Low-income families would have to pay between 111% and 159% of their income in all seven of the above markets to cover a mortgage.
The Top 5 Least Cost-Burdened Markets
By contrast, many of the least cost-burdened markets were located in Illinois. In the top five least cost-burdened markets, typical families needed to spend just 16-18% of their income to pay for a mortgage on an existing home. These markets are:
Decatur, Ill. (16%)
Elmira, N.Y. (16%)
Springfield, Ill. (17%)
Peoria, Ill. (17%)
Davenport-Moline-Rock Island, Iowa-Ill. (18%)
Low-income families in these markets would have to pay between 32% and 36% of their income to cover the mortgage payment for a median-priced existing home.
Visit nahb.org/chi for tables and details.
This article was originally published by a eyeonhousing.org . Read the Original article here. .




It’s around this time that I’ve often seen homeowners concerned about progress. Yes, plumbers are there, but where are the new sinks? Why isn’t there a single light fixture installed yet? Is the HVAC guy even working, or is he just taking a nap in the attic?
The other contributing factor to the crisis is the fact that any speed bumps that crop up during this phase take a bit more time to resolve. Overall, the placement of existing framing is the biggest obstacle in mechanical rough-ins.
If your plans specify that there is going to be a can light in Location A, but Location A has a structural beam directly above it — no can do. Or say your architect has designated a toilet to be mounted on the wall instead of on the ground, but existing wall framing prevents this from being a viable option. Back to the drawing board. Or maybe your HVAC contractor needs to be able to provide ductwork to a new vent hood location in your kitchen, but there is no open attic space to place the ducts. Time to think through the alternatives.
Another obstacle, which is less common but should still be noted, is the condition of existing mechanicals. Any wiring, plumbing or venting that is found to be damaged, dangerous or just not up to par with your municipality’s building code will likely need to be remedied.
And don’t even get me started on inspections. If your job is permitted, inspections for mechanicals will occur during this stage. City building inspectors are (at least where I’m from) well known for being thorough. If you don’t have everything just right (which ultimately is good, because they’re looking out for your safety), they will not hesitate to make your contractor fix the issue before any work can continue.
See why you should hire a professional who uses Houzz Pro software