Tag

CountyLevel

Browsing


Residential improvement activity remained solid in 2024, though growth has moderated from the surge seen in 2022. The market continues to be supported by an aging housing stock, elevated homeowner equity, and a growing need for aging-in-place improvements. According to the 2024 Home Mortgage Disclosure Act (HMDA) data, the number of home improvement loan applications declined 3% from a year earlier, while the total dollar volume of these loans held steady at approximately $144 billion, essentially unchanged from 2023.

In this article, NAHB’s analysis of the 2024 HMDA data provides insight into remodeling trends across states and counties nationwide. The 2024 HMDA data, published by Consumer Financial Protection Bureau (CFPB), includes detailed information on residential mortgage lending, such as loan purpose and type, loan characteristics, and demographic information about loan applicants.

State-Level Analysis:

Remodeling activity varies not only by borrowers’ age but also across geographic areas, reflecting differences in cost of living, local economic conditions, and house prices.

With respect to the total number of home improvement loan applications, California recorded the highest number in 2024, with 120,167 applications. Florida ranked second with 94,901 home improvement loan applications. At the other end of the spectrum, Wyoming, Alaska, and Puerto Rico had the lowest total numbers of home improvement loan applications, with 212, 1,397, and 1,600 applications, respectively.

When adjusting for population size, smaller states stand out. Rhode Island and New Hampshire recorded the highest number of home improvement loan applications per 1,000 people, at 6.0 and 5.6, respectively. Maine and Idaho ranked third and fourth, followed by Utah with 5.3 applications per 1,000 people.

Nationally, there were 3.5 home improvement loan applications for every 1,000 people in 2024. California, the nation’s most populous state, reported 3.0 applications per 1,000 people, which is lower than the national average.

County-Level Analysis:

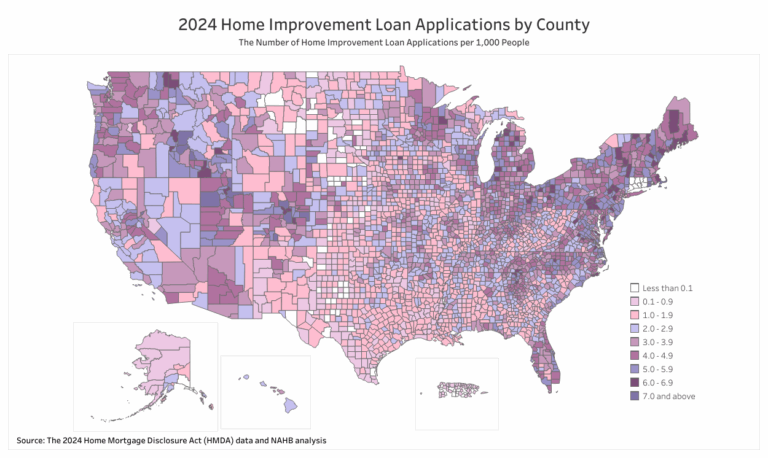
The analysis of county-level home improvement loan applications per 1,000 people reveals that overall population size is not strongly correlated with per capita remodeling loan activity. In 2024, the ten most populous counties in the United States had an average of 2.6 home improvement loan applications per 1,000 people. Los Angeles County in California, one of the nation’s largest counties, reported 2.7 applications per 1,000 people. 

In contrast, several counties with a lower population had higher levels of home improvement loan applications relative to their population. For example, Rich County in Utah, with roughly 3,000 people, had the highest level nationwide at 12.0 applications per 1,000 people. Camas County in Idaho, with approximately 1,000 people, ranked higher than 99.9% of U.S. counties on this measure.

Additionally, the analysis finds that home improvement loan applications are relatively more common in the Mountain and New England divisions. In total, there were 30 counties that reported 7 or higher home improvement loan applications per 1,000 people, and about 73% of these counties were located in the Mountain and New England divisions. None of these 30 counties were in the West South Central, or Pacific divisions.

The five counties with the highest number of home improvement loan applications relative to their population in 2024 were: Washington County (WI), Rich County (UT), Camas County (ID), Boise County (ID), and Nantucket County (MA).


This article was originally published by a eyeonhousing.org . Read the Original article here. .

Residential improvement spending softened in 2023 due to elevated interest rates, high inflation, and sluggish home sales. According to the Bureau of Economic Analysis’ National Income and Product Accounts (NIPA), expenditures for residential home improvements rose 2% to $363 billion in 2023, from $356 billion in 2022. The 2% year-over-year (YOY) gain in 2023 marks the smallest YOY gain since 2011. This annual data indicates that the YOY gain in residential improvement spending slowed, but the remodeling market remained solid.

In this article, NAHB’s analysis of the 2023 Home Mortgage Disclosure Act (HMDA) data provides insight into remodeling activity in 2023 by age group, and by U.S. states and counties. The 2023 HMDA data, published by the Consumer Financial Protection Bureau (CFPB), covers detailed information on residential mortgage lending in 2023, including the type, purpose, and characteristics of home mortgage applications or purchased loans, and demographic and other information about loan applicants.

According to the 2023 HMDA data, the number of home improvement loan applications declined by 17% in 2023, compared to the previous year. Moreover, the total amount of home improvement loans was about 44 billion (24%) less than the total amount in 2022.

Age Group Analysis:

Figure 1 below presents the number of home improvement loan applications by applicants’ age from 2018 to 2023. Among all age groups, the number of home improvement loan applications surged in 2022 and declined in 2023. Compared to 2022, the number of home improvement loan applications decreased by 23% in 2023 for applicants aged between 25 and 34 and between 35 and 40. Applicants between the ages of 45 and 54 remained the largest age group to apply for home improvement loan applications, even though the number of loan applications for this age group reduced by 18% in 2023.

For applicants under 55 years old and above 74 years old, the number of loan applications in 2023 was higher than the pre-pandemic level in 2018 and 2019. Meanwhile, applicants aged between 55 and 74 had a lower number of loan applications in 2023 than in 2018 and 2019. As interest rates reached historically high levels in 2023, homeowners used savings to pay for home improvements, avoiding the extra expense of interest on loans.

State-Level Analysis:

While remodeling activity changed among different age groups, remodeling has also varied across geographic locations due to the cost of living, local economic conditions, and house prices.

With respect to total home improvement loan applications, California had the highest number of home improvement loan applications in 2023, with 118,649 applications. Florida came in second with 102,746 home improvement loan applications. Wyoming and Alaska had the lowest total numbers of home improvement loan applications with 1,312 and 1,358, respectively.

When we look at home improvement loan applications per 1,000 population, two states in New England, Rhode Island and New Hampshire, had the highest number of home improvement loan applications, with a rate of 6.4 and 6.0 applications per 1,000 population, respectively. Louisiana had the lowest number of home improvement loan applications, with a rate of 1.6 applications per 1,000 population.

In total, there were 3.7 loan applications for home improvements for every 1,000 population in the United States. California, the most populous state of the United States, reported 3.0 applications per 1,000 population, which is lower than the national average rate.

County-Level Analysis:

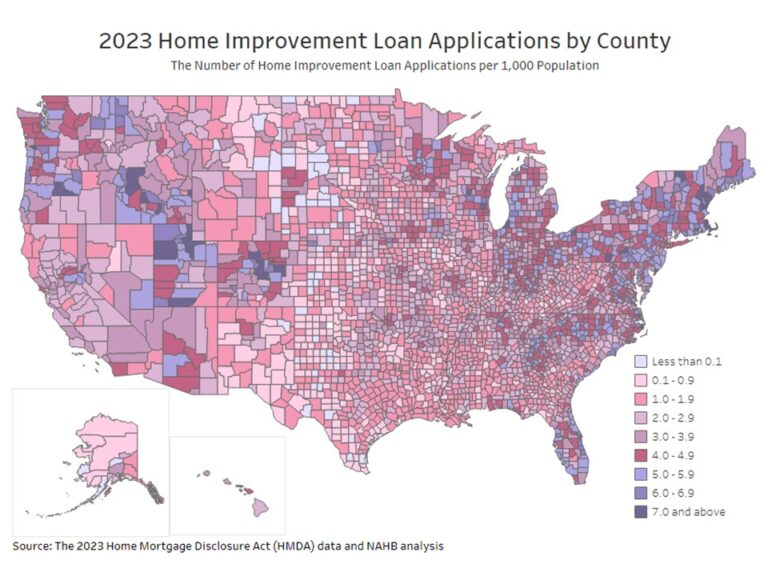
The analysis of county-level home improvement loan applications per 1,000 population reveals that the aggregate market population is not significantly related to the number of per capita home improvement loan applications. In 2023, the top 10 most populated counties in the United States had an average rate of 2.6 loan applications per 1,000 population. Los Angeles County in California, one of the most populous counties, reported a rate of 2.8 loan applications per 1,000 population in 2023.  Meanwhile, some counties with a lower population had a higher loan application rate (that is, the number of home improvement loan applications per 1,000 population). For example, Nantucket County in Massachusetts, with a population of about 14,000, had the highest loan application rate of 11.1 among all the counties in the United States. Camas County in Idaho, with roughly one thousand population, had a loan application rate of 8.9, higher than about 99.7% of the counties in the United States.

Additionally, the analysis finds that home improvement loan applications are relatively more common in the Mountain and New England Divisions. In total, there were 43 counties that reported 7 or higher home improvement loan applications per 1,000 population, and more than 72% of these counties were in the Mountain and New England Divisions. None of these 43 counties were in the West South Central, East South Central, or West North Central Divisions. The top five counties with the highest home improvement loan application rate were: Nantucket County (MA), Grand Isle County (VT), Dare County (NC), Boise County (ID), and Barnstable County (MA).

Discover more from Eye On Housing

Subscribe to get the latest posts sent to your email.


This article was originally published by a eyeonhousing.org . Read the Original article here. .
Pin It