Tag

Construction

Browsing


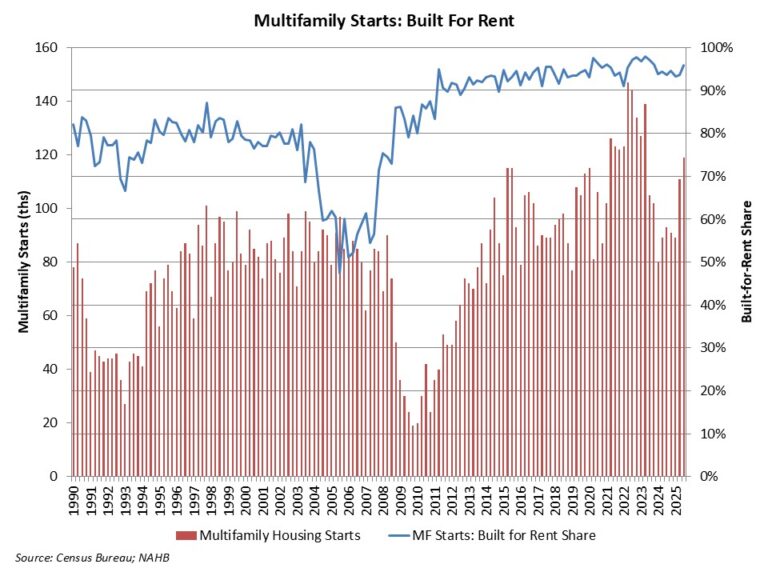
According to NAHB analysis of quarterly Census data, the count of multifamily, for-rent housing starts increased during the third quarter of 2025. For the quarter, 119,000 multifamily residences started construction. Of this total, 114,000 were built-for-rent. This built-for-rent total was 31% higher than the third quarter of 2024. This marks a significant increase, and it is possible these numbers will be revised lower in future Census data given other multifamily data reporting.

The market share of rental units of multifamily construction starts was 95% for the third quarter. A historical low market share of 47% for built-for-rent multifamily construction was set during the third quarter of 2005, during the condo building boom. An average share of 80% was registered during the 1980-2002 period.

For the third quarter, there were 5,000 multifamily condo unit construction starts, a decrease from a year ago.

An elevated rental share of multifamily construction is holding the typical apartment size below levels seen during the pre-Great Recession period. According to the third quarter 2025 data, the average square footage of multifamily construction starts decreased to 1,052 square feet. The median declined to 1,006 square feet. These measures are consistent with the elevated share of multifamily built-for-rent construction.


This article was originally published by a eyeonhousing.org . Read the Original article here. .


Townhouse construction gained single-family construction market share during the third quarter of 2025.

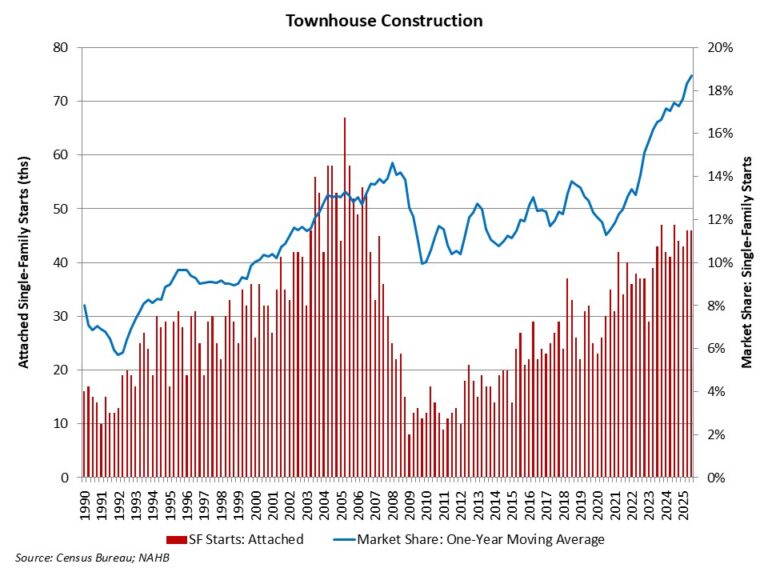
According to NAHB analysis of the most recent Census data of Starts and Completions by Purpose and Design, during the third quarter of 2025, single-family attached starts totaled 46,000. Over the last four quarters, townhouse construction starts totaled a strong 179,000 homes, which is 1% higher than the prior four-quarter period (177,000). Townhouses made almost 20% all of single-family housing starts for the third quarter of the year.

Using a one-year moving average, the market share of newly-built townhouses stood at 18.7% of all single-family starts for the third quarter. With gains over the last year, the four-quarter moving average market share is the highest on record, for data going back to 1985.

Prior to the current cycle, the peak market share of the last two decades for townhouse construction was set during the first quarter of 2008, when the percentage reached 14.6% on a one-year moving average basis. This high point was set after a fairly consistent increase in the share beginning in the early 1990s.

The long-run prospects for townhouse construction are positive given growing numbers of homebuyers looking for medium-density residential neighborhoods, such as urban villages that offer walkable environments and other amenities. Where it can be zoned, it can be built.


This article was originally published by a eyeonhousing.org . Read the Original article here. .


The latest residential housing market report, delayed by the federal government shutdown last fall, indicates that builders have faced significant headwinds in recent months. Elevated mortgage rates earlier in the year have restrained buyer demand and weighed on home building activity, alongside persistently high construction costs.

Overall housing starts declined 4.6 percent in October to a seasonally adjusted annual rate of 1.25 million units, according to the U.S. Department of Housing and Urban Development and the U.S. Census Bureau. This pace reflects the number of housing units builders would begin over the next 12 months if October’s activity were sustained.

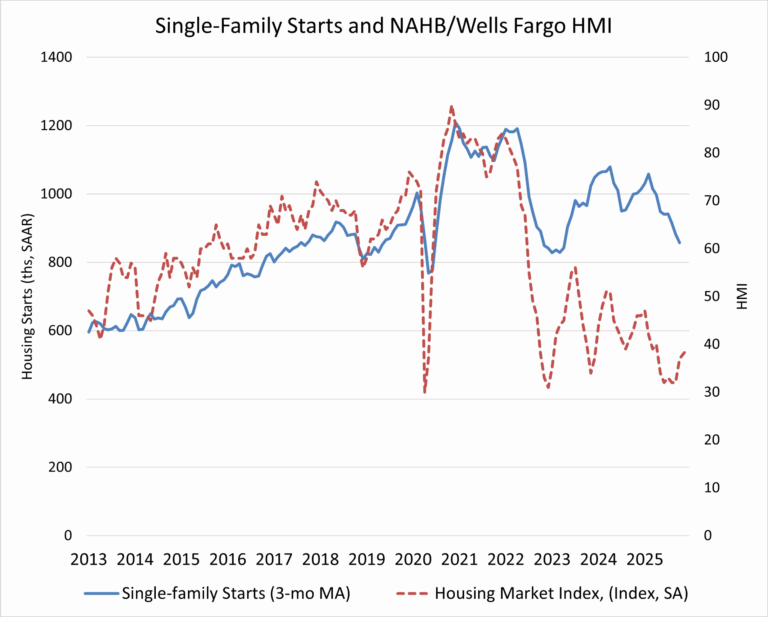
Within the total, single-family starts rose 5.4 percent to a seasonally adjusted annual rate of 874,000 units but remain 7.8 percent lower than a year earlier. On a year-to-date basis, single-family starts are down 7.0 percent. Given recent volatility, the three-month moving average provides a clearer signal, declining to 857,000 units.

In contrast, multifamily starts, which include apartment buildings and condominiums, fell sharply, down 22.0 percent to an annualized pace of 372,000 units. The three-month moving average for multifamily construction has trended lower to 424,000 units, and activity is 7.9 percent below year-ago levels.

Regionally and on a year-to-date basis, combined single-family and multifamily starts increased 9.1 percent in the Midwest and 8.5 percent in the Northeast, while declining 1.9 percent in the West and 4.1 percent in the South.

The total number of housing units under construction stood at 1.3 million in October, down 10.1 percent from a year earlier. Single-family homes under construction fell to 596,000 units, a 7.0 percent year-over-year decline and the lowest level since November 2020. Multifamily units under construction declined to 790,000, down from peaks above 1 million units in December 2023 and 4.0 percent lower than a year ago.

Completions of single-family homes remained relatively strong at an annual rate of about 1 million units, reflecting continued progress in finishing projects already underway and marking a 2.0 percent increase from a year earlier. Multifamily completions, however, dropped sharply, down 41.7 percent year over year to a 377,000-unit pace. On a year-to-date basis, total completions across both sectors are down 9.2 percent.

Overall building permits edged down 0.2 percent in October to a 1.41-million-unit annualized rate. Single-family permits declined 0.5 percent to 876,000 units and are 9.4 percent lower than a year ago, with year-to-date permits down 7.0 percent. Multifamily permits were essentially unchanged at a 536,000-unit pace compared to the previous month and are up 16.3 percent compared to October 2024. Regionally, year-to-date total permits increased 5.9 percent in the Midwest, while declining 3.3 percent in the West, 4.0 percent in the South, and 9.3 percent in the Northeast.


This article was originally published by a eyeonhousing.org . Read the Original article here. .


The count of open, unfilled positions in the construction industry increased in November, per the delayed Bureau of Labor Statistics Job Openings and Labor Turnover Survey (JOLTS). The current level of open jobs is down measurably from two years ago due to declines in construction activity, particularly in housing.

The number of open jobs for the overall economy declined as the labor market weakened at the end of 2025, falling from 7.449 million in October to 7.146 million in November. The November reading was down from a year ago (8.031 million).

Previous NAHB analysis indicated that this number had to fall below eight million on a sustained basis for the Federal Reserve to move forward on interest rate reductions. With estimates remaining below eight million for national job openings, the Fed, in theory, should be able to cut further.

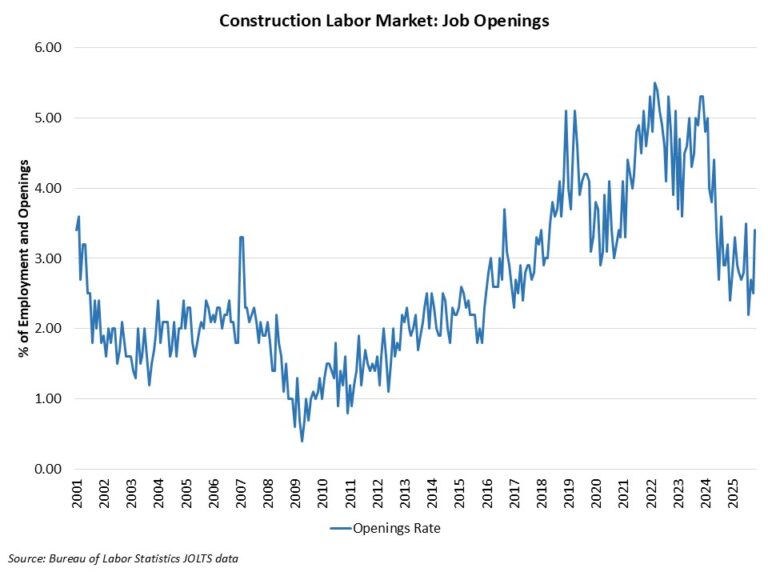
The number of open construction sector jobs increased from 202,000 in October to 292,000 in November. This total is relatively stable compared to a year ago (272,000), although the reading is notably lower than two years ago. The chart below notes the declining trend that has been in place for unfilled construction jobs since the Fed raised the federal funds rate and home building weakened. While home building employment was declining during the second half of 2025, other subsectors of the construction industry have expanded (e.g. data centers).

The construction job openings rate increased to 3.4% in November, higher than the 3.2% rate estimated a year ago.

The layoff rate in construction declined to 1.7% in November. The quits increased to 1.5% for the month.


This article was originally published by a eyeonhousing.org . Read the Original article here. .


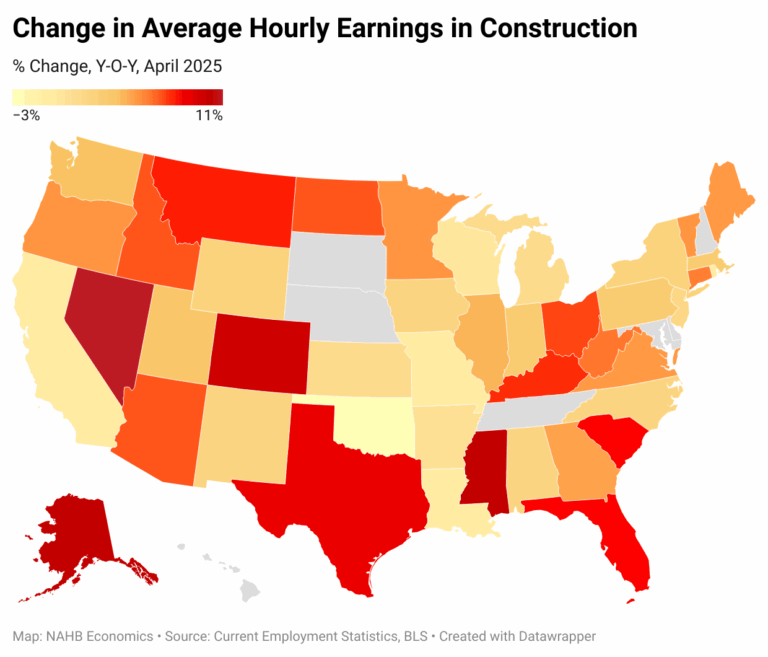
Wage growth in construction continued to decelerate in April on a national basis, but the differences across regional markets remain stark. Nationally, average hourly earnings (AHE) in construction increased 3.6% year-over-year and crossed the $39.3 mark when averaged across all payroll employees (non-seasonally adjusted, NSA). Meanwhile, average earnings in construction in Alaska and Massachusetts exceeded $50 per hour (NSA). Across states, the annual growth rate in AHE ranged from 10.6% in Nevada to a decline of 3% in Oklahoma. This is according to the latest Current Employment Statistics (CES) report from the Bureau of Labor Statistics (BLS).   

Average hourly earnings (AHE) in construction vary greatly across 43 states that report these data. Alaska, states along the Pacific coast, Illinois, Minnesota, and the majority of states in Northeast record the highest AHE. As of April 2025, fourteen states report average earnings (NSA) exceeding $40 per hour.

At the other end of the spectrum, nine states report NSA average hourly earnings in construction under $34. The states with the lowest AHE are mostly in the South, with Arkansas reporting the lowest rate of $29.3 per hour.

While differences in regional hourly rates reflect variation in the cost of living across states among other things, the faster growing wages are more likely to indicate specific labor markets that are particularly tight. Year-over-year, Nevada, Mississippi, Alaska, Colorado, Texas, Florida, South Carolina, and Montana reported fastest growing hourly wages in construction, more than doubling the national average growth of 3.6%. Nevada reported the largest annual increase of 10.6%, while the growth rate in Mississippi and Alaska was just under 10%.

In sharp contrast, Oklahoma registered a decline in hourly wages of 3%. Five other states reported modestly declining hourly rates in construction, compared to a year ago – Louisiana, Missouri, Rhode Island, California, and Wisconsin.


This article was originally published by a eyeonhousing.org . Read the Original article here. .


The count of open, unfilled positions in the construction industry was relatively unchanged in October, per the Bureau of Labor Statistics Job Openings and Labor Turnover Survey (JOLTS). The current level of open jobs is down measurably from two years ago due to declines in construction activity, particularly in housing.

The number of open jobs for the overall economy was effectively unchanged, increasing from 7.66 million in September to 7.67 million in October. The October reading was was relatively unchanged from the 7.62 million estimate from a year ago.

Previous NAHB analysis indicated that this number had to fall below 8 million on a sustained basis for the Federal Reserve to move forward on interest rate reductions. With estimates remaining below 8 million for national job openings, the Fed, in theory, should be able to cut further.

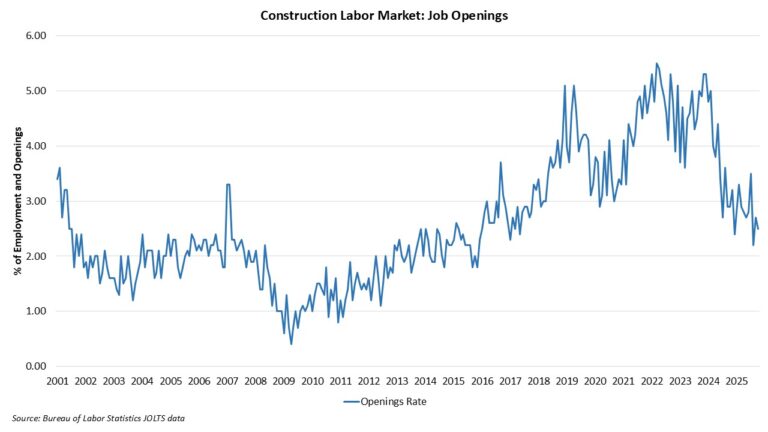
The number of open construction sector jobs decreased from 231,000 in September to 213,000 in October. This total is relatively stable compared to a year ago (249,000), although the reading is notably lower than two years ago. The chart below notes the declining trend that has been in place for unfilled construction jobs since the Fed raised the federal funds rate and home building weakened.

The construction job openings rate declined to 2.5% in October, lower than the 2.9% rate estimated a year ago.

The layoff rate in construction declined to 1.8% in October. The quits rate edged lower to 1.4% in October.


This article was originally published by a eyeonhousing.org . Read the Original article here. .


Single-family construction lending picked up in the third quarter, amidst the overall cooling lending environment. Loan balances for 1-4 family construction grew to $91.2 billion in the third quarter, registering the first annual increase in over two years. However, across all acquisition, development and construction (AD&C) loans, the total volume fell for the seventh straight quarter.

According to data from the Federal Deposit Insurance Corporation (FDIC), the total level of outstanding AD&C loans fell to $463.0 billion in the third quarter of 2025, down 5.6% from one year ago. This year-over-year decrease was led by a drop in other real estate development loans, which decreased 7% over the year to $371.8 billion. Meanwhile, the volume of 1-4 family residential construction and land development loans rose to $91.2 billion in the third quarter, up 0.5% from one year ago.

It is worth noting, the FDIC data represent only the stock of loans, not changes in the underlying flows, so it is an imperfect data source. Nonetheless, lending remains much reduced from years past. The current amount of existing 1-4 family residential AD&C loans now stands 56% lower than the peak level of residential construction lending of $204 billion reached during the first quarter of 2008. Alternative sources of financing, including equity partners, have supplemented this capital market in recent years.

Quality Metrics of Construction Loans

While the total volume of 1-4 family residential construction loans rose, the volume of loans 30+ days past due or nonaccrual status fell slightly to $1.1 billion over the quarter. As a share of the total 1-4 family residential construction loan volume, this accounts for 1.2%.

Breaking this out further, the level of loans 30-89 days past due was $418.1 million, while the volume in nonaccrual status was $593.4 million. The nonaccrual loan status volume increased from $572.4 million in the second quarter and the 30-89 past due fell from $469.2 million.

Loans are classified as nonaccrual when one or more of the following conditions apply: the loan is 90 days or more past due on principal or interest (unless it is well-secured and in the process of collection); the bank no longer expects full repayment of principal and interest; or the borrower’s financial condition has significantly deteriorated, warranting cash-basis accounting.


This article was originally published by a eyeonhousing.org . Read the Original article here. .


Private residential construction spending inched up 0.8% in August, continuing steady growth since June 2025. This modest increase was primarily driven by more spending on multifamily construction and home improvements. However, total spending was 2% lower than a year ago, as the housing sector continues to navigate the economic uncertainty stemming from ongoing tariff concerns and elevated mortgage rates. 

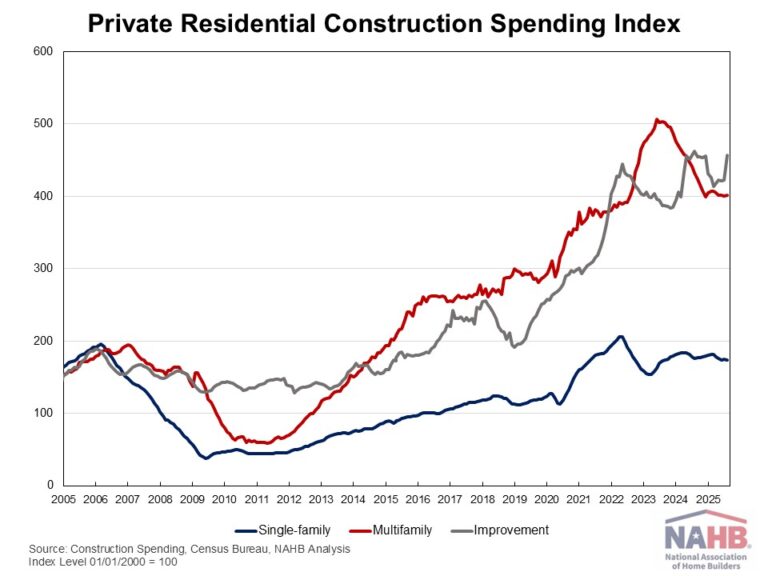
According to the latest U.S. Census construction spending data, single-family construction spending slipped 0.4% in August, in line with the soft builder sentiment reflected in the August NAHB/Wells Fargo Housing Market Index (HMI). Compared to a year ago, single-family construction spending decreased by 1.1%. Improvement spending (remodeling) posted a solid 8.2% gain for the month, but it remained 1.3% lower than in August 2024. The remodeling sector continues to show resilience, supported by strong homeowner equity and persistent demand for home improvements. Meanwhile, multifamily construction spending rose 0.2% in August, marking a pause in the downward trend that began in mid-2023. Compared to a year earlier, multifamily spending was down 7.1%.  

The NAHB construction spending index is shown in the graph below. The index illustrates how   spending on single-family construction has slowed since early 2024 under the pressure of elevated interest rates and concerns over building material tariffs. Multifamily construction spending growth has also slowed down after the peak in July 2023. Improvement spending has also been weakening since the beginning of 2025. 

Spending on private nonresidential construction was down 4% over a year ago. The annual private nonresidential spending decrease was primarily driven by a $20 billion drop in manufacturing construction spending, followed by a $11 billion decrease in commercial construction spending.


This article was originally published by a eyeonhousing.org . Read the Original article here. .


As the nation’s housing stock continues to age and new homes remain out of reach for many buyers, remodeling is capturing a growing share of the residential construction market, both in terms of the number of firms and employment. With most U.S. households unable to afford new construction, renovation has become a more practical and cost-effective alternative to improve housing conditions, driving demand on the consumer side. On the supply side, many home builders undertake remodeling projects to grow their business. NAHB’s analysis of the quarter-century of Quarterly Census of Employment and Wages (QCEW) data suggests that the rise of remodelers is a sustained structural shift rather than a temporary post-pandemic surge.

Remodeling Firms’ Share in Residential Construction is Rising
Over the past 25 years, the number of remodeling establishments has nearly doubled—from fewer than 69,000 in 2000 to more than 128,000 in the first quarter of 2025. Remodelers now represent over half (56%) of all residential building construction (RBC) establishments. By contrast, during the mid-2000s housing boom, remodelers’ share consistently hovered around 38–39%, when the market was dominated by home builders, including new single-family and multifamily general contractors as well as speculative (spec) home builders.

Although the remodeling sector was not immune to the 2008 housing crash, its losses were modest compared to the contraction of home building. Between 2007 and 2012, the number of remodeling establishments fell by 8%, while roughly one-third of home builders went out of business. As a result, the remodeler’s share of the RBC sector rose sharply after the crash, reaching 46% in 2011, and has continued to climb steadily ever since.

During the post-pandemic housing boom, driven by low mortgage rates, the rise of remote work, and a renewed demand for larger living spaces, both remodelers and home builders experienced solid growth. However, remodelers expanded their ranks at a faster pace, with their share of RBC firms climbing to 54% by 2022. Less sensitive to fluctuations in mortgage rates than home builders, remodelers have continued to grow even amid a series of aggressive Federal Reserve rate hikes that sharply increased the cost of home purchases and slowed new construction. As of 2024, remodeling firms account for 56% of all RBC establishments.

Remodeling Employment Share in RBC is Rising

In the overall construction industry, which encompasses residential and non-residential building construction, as well as heavy/civil engineering construction, land subdivision, and specialty trade contractors, it is the latter that dominate the overall sector employment. However, the government employment surveys cannot identify what portion of subcontractors’ business is devoted to remodeling. As a result, RBC is the subsector that allows tracking the remodeling trends best.

The analysis of employment trends in residential building construction reveals a similar pattern, with remodelers generating a rising number and share of jobs, largely at the expense of single-family general contractors. As of 2024, the remodeling sector accounted for almost half (49%) of RBC workers. In contrast, during the housing boom of the mid-2000s, only 30% of payroll employees worked for remodelers, while single-family general contractors employed 63% of the RBC workforce.

The shift is even more pronounced within the production (nonsupervisory) workforce of the RBC industry.  More than half (51.2%) of these skilled craftsmen now work for remodeling firms, compared with roughly 30% in the early 2000s, according to NAHB’s analysis of historical data from the Bureau of Labor Statistics’ Current Employment Statistics (CES) survey.

Multifamily general contractors, who subcontract out most of their construction work, account for a smaller share of home building jobs but have also gained ground. Fueled by strong multifamily activity in 2022–2023, their share of RBC employment grew to 5% by 2024. For-sale builders account for an additional 6%.

The typical remodeling firm remains small, averaging between 3 and 4 employees per establishment, comparable to levels observed during the mid-2000s housing boom. This stability suggests that the overall rise in remodeling employment stems primarily from the creation of new firms or the reclassification of home builders shifting toward renovation work as remodelers. It is likely that, as market conditions change, some home builders, particularly smaller single-family general contractors, pivot toward renovation projects to stay and grow their business. The remodeling sector’s lower barriers to entry, smaller upfront investments compared to new construction, and fewer regulatory hurdles make the transition easier.

As more companies view remodeling as their primary activity and revenue source, more will be reclassified as remodeling establishments in the official data reporting. This is because data collection in the U.S. is guided by the North American Industry Classification System (NAICS). Under NAICS, a company self-classifies and chooses the industry code that best captures its primary activity. In some surveys, such as the Economic Census, the Census Bureau emphasizes revenue sources as a primary metric for categorizing businesses. The steadily rising number of remodelers and the jobs they create underscores that renovation has become the reliable engine driving growth in the residential construction sector.
This article was originally published by a eyeonhousing.org . Read the Original article here. .


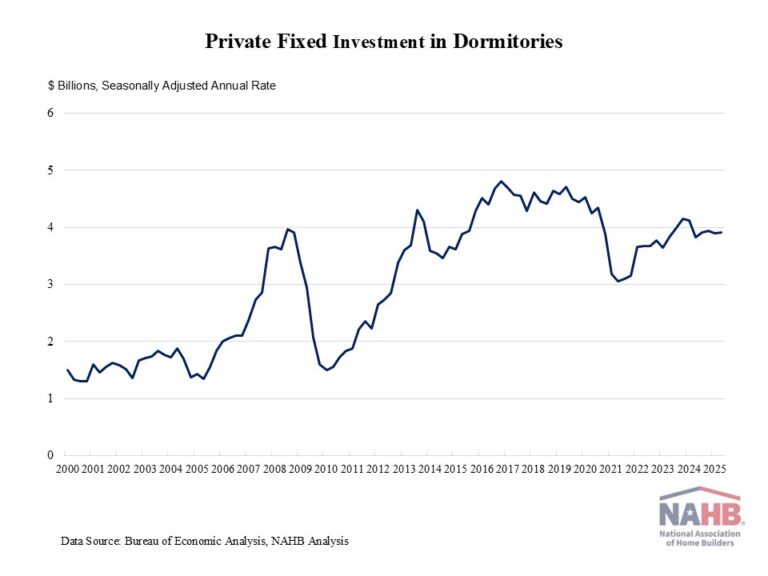
Private fixed investment in student dormitories inched up 0.3% in the second quarter of 2025, reaching a seasonally adjusted annual rate (SAAR) of $3.9 billion. This gain followed a 1.1% decrease in the previous quarter, as elevated interest rates placed a damper on student housing construction. Moreover, private fixed investment in dorms was 2.1% higher than a year ago 

Private fixed investment in student housing experienced a surge after the Great Recession, as college enrollment increased from 17.2 million in 2006 to 20.4 million in 2011. However, during the pandemic, private fixed investment in student housing declined drastically from $4.4 billion (SAAR) in the last quarter of 2019 to a lower annual pace of $3 billion in the second quarter of 2021, as COVID-19 interrupted normal on-campus learning. According to the National Student Clearinghouse Research Center, college enrollment fell by 3.6% in the fall of 2020 and by 3.1% in the fall of 2021.  

Since then, private fixed investment in dorms has rebounded, as college enrollments show a gradual recovery from pandemic driven declines. Effective in-person learning requires college students to return to campuses, boosting the student housing sector.  Still, demographic trends are reshaping the outlook for student housing. The U.S. faces slower growth in the college-age population as birth rates declined following the Great Recession. As a result, total enrollment in postsecondary institutions is projected to only increase 8% from 2020 to 2030, according to the National Center for Education Statistics, well below the 37% increase between 2000 and 2010. 

Despite recent fluctuations, the student housing construction shows signs of recovery and future growth is expected in response to increasing student enrollment projections. 

Discover more from Eye On Housing

Subscribe to get the latest posts sent to your email.


This article was originally published by a eyeonhousing.org . Read the Original article here. .

Pin It