Tag

construction statistics

Browsing


Private residential construction spending fell by 0.5% in May, marking the fifth straight month of decreases. This drop was primarily driven by reduced spending on single-family construction. Compared to a year ago, total spending was down 6.7%, as the housing sector continues to navigate the economic uncertainty stemming from ongoing tariff concerns and elevated mortgage rates.

According to the latest U.S. Census Construction Spending data, single-family construction spending declined by 1.8% in May. This decrease aligns with the third lowest reading of NAHB/Wells Fargo Housing Market Index (HMI) since 2012. Compared to a year ago, single-family construction spending decreased by 4.5%. Meanwhile, multifamily construction spending stayed flat for the month but continued to follow the downward trend that began in mid-2023. Compared to May 2024, multifamily spending was down 10.9%. Improvement spending (remodeling) was up 0.9% in May but was 7.8% lower on a year-over-year basis.

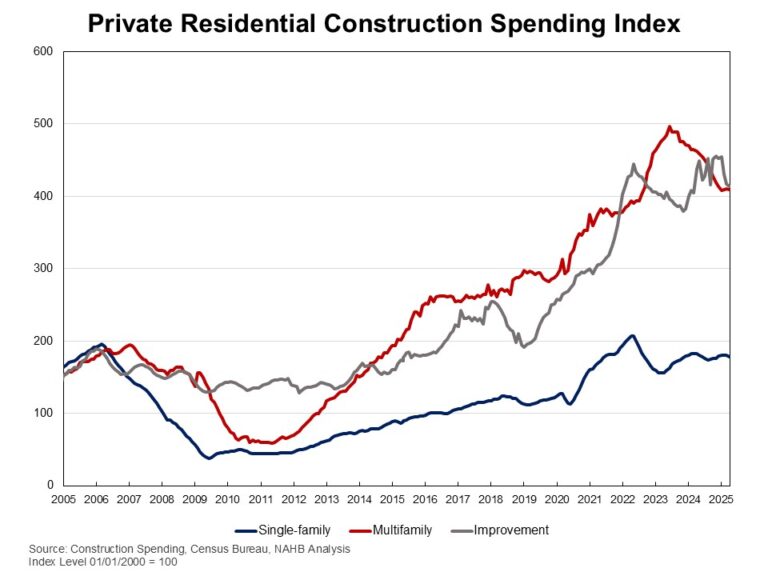
The NAHB construction spending index is shown in the graph below. The index illustrates how   spending on single-family construction has slowed since early 2024 under the pressure of elevated interest rates and concerns over building material tariffs. Multifamily construction spending growth has also slowed down after the peak in July 2023. Improvement spending has also been weakening since the beginning of 2025.

Spending on private nonresidential construction was down 3.9% over a year ago. The annual private nonresidential spending decrease was primarily driven by a $15 billion drop in commercial construction spending, followed by a $9.0 billion decrease in the manufacturing category.

Discover more from Eye On Housing

Subscribe to get the latest posts sent to your email.


This article was originally published by a eyeonhousing.org . Read the Original article here. .


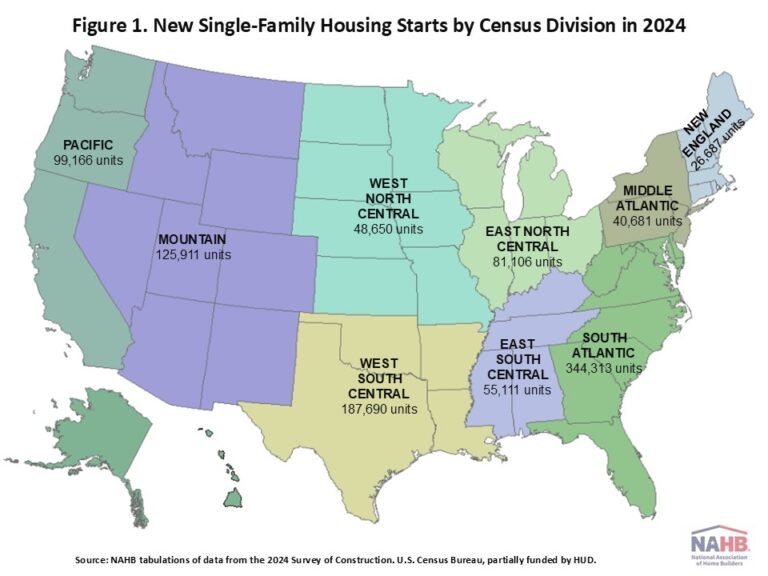
Despite persistently high mortgage rates, elevated financing costs for builders, and a shortage of buildable lots, single-family starts rebounded in 2024, following two straight years of declines. According to the National Association of Home Builders’ analysis of the 2024 Survey of Construction (SOC), a total of 1,009,315 new single-family units started construction nationwide. This is a 7% increase compared to 2023.

Among the nine Census divisions, the South Atlantic division led the nation with 344,313 starts in 2024, representing a 34% share. The second highest was the West South Central division at 187,690 starts, followed by the Mountain division with 125,911 starts. Collectively, these three divisions, covering 20 states and Washington, D.C., and representing approximately 41% of the United States, accounted for nearly two-thirds of the total new single-family housing starts in 2024.

Meanwhile, there were 99,166 new single-family units started in the Pacific division (10% of total starts) and 81,106 in the East North Central division (8%) in 2024. The other four divisions, including East South Central, West North Central, Middle Atlantic, and New England, accounted for the remaining 17% of the total new single-family housing starts.

In 2024, seven out of nine divisions experienced year-over-year growth in single-family starts. The Middle Atlantic division had the strongest performance among all regions, posting a 22% annual increase. In addition, five out of nine divisions surpassed the U.S. growth rate of 7%. Conversely, both the East South Central and West South Central divisions recorded declines in single-family housing starts.

Compared to the previous year, the New England and West South Central divisions experienced a deceleration in growth, while the East South Central division marked its second consecutive year of decreases. In contrast, the remaining six divisions reported an acceleration in growth. Despite regional disparities, the overall national trend in 2024 reflected a resilient housing market, even in the face of ongoing economic and supply-side challenges.

Discover more from Eye On Housing

Subscribe to get the latest posts sent to your email.


This article was originally published by a eyeonhousing.org . Read the Original article here. .


Elevated interest rates and economic uncertainty sent more home buyers to the sidelines in May as housing affordability conditions remain challenging.

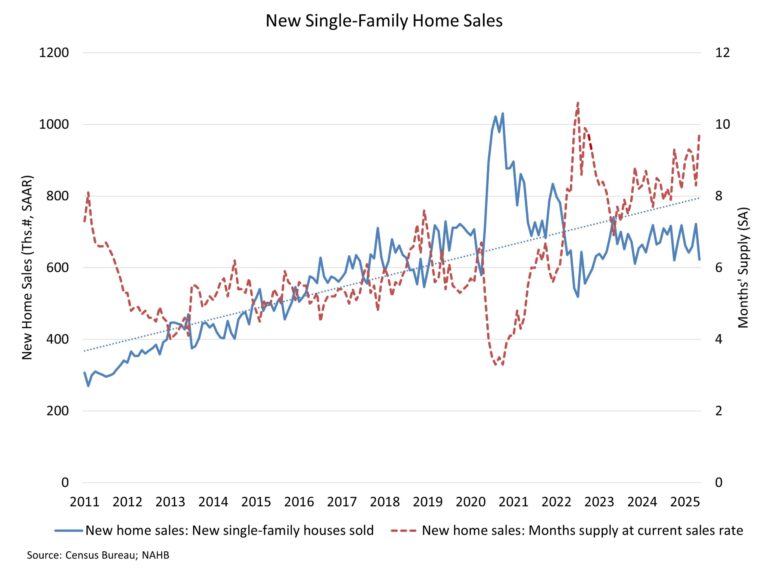
Sales of newly built single-family homes declined 13.7% in May, falling back to a seasonally adjusted annual rate of 623,000 according to newly released data from the U.S. Department of Housing and Urban Development and the U.S. Census Bureau. This was the slowest pace since October of last year, as mortgage rates averaged 6.83% in May. Sales were particularly slow in the South, with the pace of sales down 21% in May.

The slowing of the housing market has occurred despite the growing use of of builder sales incentives, including 37% of home builders reporting cutting prices in the June NAHB/Wells Fargo Housing Market Index survey.

On a year-to-date basis, new home sales are 3.2% lower thus far in 2025. As a result of slowing home sales conditions, inventory continues to rise, marking an elevated 9.8 months’ supply in May.

As estimated by NAHB, total months’ supply, defined as a combination of current new and resale single-family inventory, now stands at 5.2. This is the highest sales-adjusted inventory level since 2015 and will place downward pressure on housing construction starts in the months ahead.

A new home sale occurs when a sales contract is signed, or a deposit is accepted. The home can be in any stage of construction: not yet started, under construction or completed. In addition to adjusting for seasonal effects, the May reading of 623,000 units is the number of homes that would sell if this pace continued for the next 12 months.

New single-family home inventory continued to rise with 507,000 residences marketed for sale as of May. This is 1.4% higher than the previous month and 8.1% higher than a year ago. At the current sales pace, the months’ supply for new homes stands at 9.8 compared to 8.5 a year ago. Completed, ready-to-occupy new home inventory stood at 115,000 in May, up 29% compared to a year ago on a non-seasonally adjusted basis. However, this measure was higher at the end of 2024.

The median new home sale price in May was $426,600, compared to $414,300 a year ago. This measure reflects the fact that higher income borrowers face fewer budget constraints than lower income prospective home buyers. New home sales priced below $500,000 were down 15% in May of 2025 compared to the May 2024.

Regionally, on a year-to-date basis, new home sales are down 20.7% in the Northeast, 11.9% in the Midwest and 1.8% in the South. Sales are up 2.1% in the West.

Discover more from Eye On Housing

Subscribe to get the latest posts sent to your email.


This article was originally published by a eyeonhousing.org . Read the Original article here. .


A sharp decline in multifamily production pushed overall housing starts down in May, while single-family output was essentially flat due to economic and tariff uncertainty along with elevated interest rates.

Overall housing starts decreased 9.8% in May to a seasonally adjusted annual rate of 1.26 million units, according to a report from the U.S. Department of Housing and Urban Development and the U.S. Census Bureau.

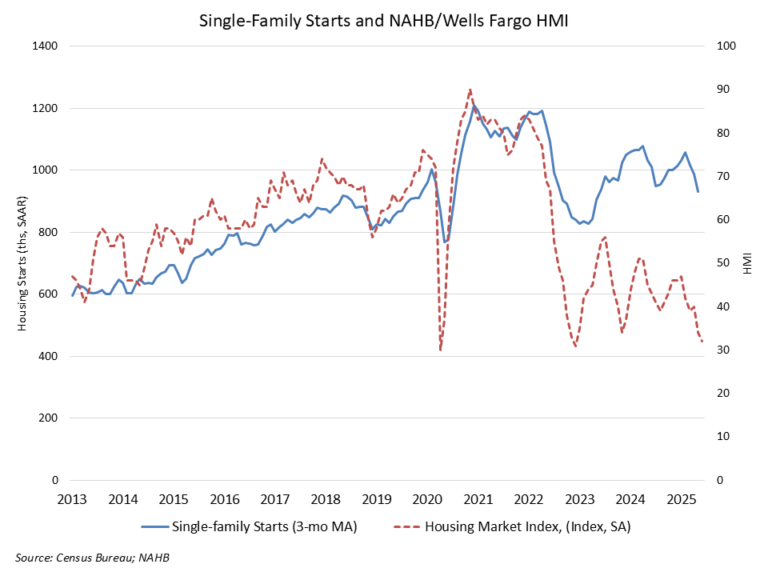
The May reading of 1.26 million starts is the number of housing units builders would begin if development kept this pace for the next 12 months. Within this overall number, single-family starts increased 0.4% to a 924,000 seasonally adjusted annual rate and are down 7.3% compared to May 2024. The volatile multifamily sector, which includes apartment buildings and condos, decreased 29.7% in May to an annualized 332,000 pace.

On a year-to-date basis, single-family starts are down 7.1%. In contrast, multifamily 5-plus unit starts are up 14.5% as more prospective home buyers remain on the sidelines helping rental demand.

Single-family permits and construction starts are down on a year-to-date basis for 2025 for what has been a disappointing spring housing market, given ongoing elevated mortgage interest rates, challenging housing affordability conditions led by higher construction costs, and macroeconomic uncertainty. NAHB is forecasting that 2025 will end with a decline for single-family housing starts.

The number of single-family homes currently under construction totaled 623,000 homes as of May. This is 1.3% lower than April, 7.6% lower than a year ago and 25% lower than the post-Great Recession peak level in June 2022. There were 752,000 apartments under construction in June, 4.6% lower than May and 18.2% lower than a year ago.

On a regional and year-to-date basis, combined single-family and multifamily starts were 21.1% higher in the Northeast, 10.8% higher in the Midwest, 6.8% lower in the South and 1.6% lower in the West.

Overall permits decreased 2% to a 1.39-million-unit annualized rate in May. Single-family permits decreased 2.7% to an 898,000-unit rate and are down 6.4% compared to May 2024. Multifamily permits decreased 0.8% to a 495,000 pace.

Looking at regional permit data on a year-to-date basis, permits were 17.2% lower in the Northeast, 6% higher in the Midwest, 5.4% lower in the South and 3.7% lower in the West.

Discover more from Eye On Housing

Subscribe to get the latest posts sent to your email.


This article was originally published by a eyeonhousing.org . Read the Original article here. .


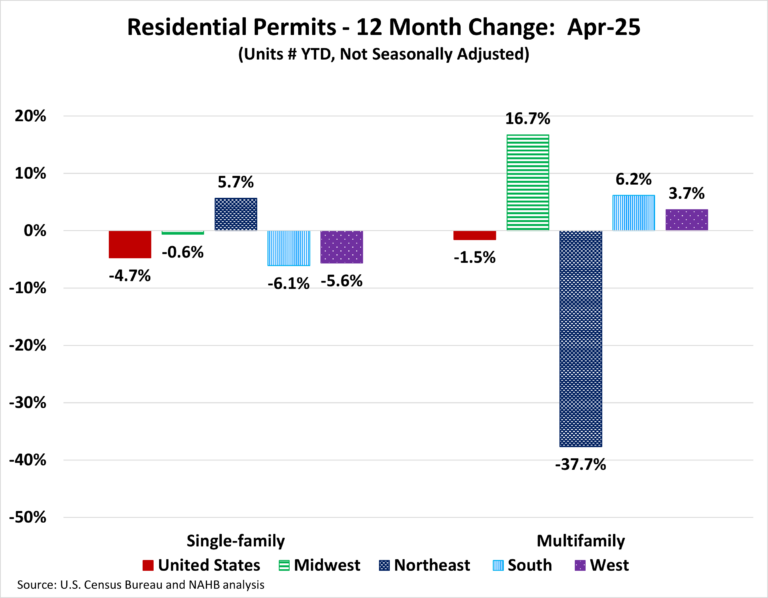
Housing permits continued a downhill trend for the fourth month in a row, pointing to a broader residential construction slowdown for 2025. Over the first four months of 2025, the total number of single-family permits issued year-to-date (YTD) nationwide reached 320,259. On a year-over-year (YoY) basis, this is a decline of 4.7% over the April 2024 level of 336,124. For multifamily, the total number of permits issued nationwide reached 154,668. This is 1.5% below the April 2024 level of 157,076.

Year-to-date ending in April, single-family permits were down in three out of the four regions. The Northeast posted an increase of 5.7%. The Midwest was down by 0.6%, the West was down by 5.6%, and the South was down by 6.1% in single-family permits during this time. For multifamily permits, three out of the four regions posted increases. The Midwest was up by 16.7%, the South was up by 6.2%, and the West was up by 3.7%. Meanwhile, the Northeast declined steeply by 37.7%.

Between April 2025 YTD and April 2024 YTD, 18 states posted an increase in single-family permits. The range of increases spanned 27.0% in Hawaii to 0.2% in Maine. The remaining 32 states and the District of Columbia reported declines in single-family permits with New Mexico reporting the steepest decline of 27.5%.

The ten states issuing the highest number of single-family permits combined accounted for 63.6% of the total single-family permits issued. Texas, the state with the highest number of single-family permits, issued 52,654 permits over the first four months of 2025; This is a decline of 7.4% compared to the same period last year. The second highest state, Florida, decreased by 9.3%, while the third highest, North Carolina, posted a decline of 1.5%.

Between April 2025 YTD and April 2024 YTD, 26 states recorded growth in multifamily permits, while 24 states and the District of Columbia recorded a decline. Alaska (+312.5%) led the way with a sharp rise in multifamily permits from 24 to 99, while New York had the biggest decline of 58.7% from 14,389 to 5,946.

The ten states issuing the highest number of multifamily permits combined accounted for 61.1% of the multifamily permits issued. Over the first four months of 2025, Florida, the state with the highest number of multifamily permits issued, experienced an increase of 18.7%. Texas, the second-highest state in multifamily permits, saw an increase of 6.8%. California, the third largest multifamily issuing state, increased by 0.2%.

At the local level, below are the top ten metro areas that issued the highest number of single-family permits.

For multifamily permits, below are the top ten local areas that issued the highest number of permits.

Discover more from Eye On Housing

Subscribe to get the latest posts sent to your email.


This article was originally published by a eyeonhousing.org . Read the Original article here. .


Prices for inputs to new residential construction—excluding capital investment, labor, and imports—rose 0.2% in May, following a (revised) decrease of 0.2% in April. These figures are taken from the most recent Producer Price Index (PPI) report published by U.S. Bureau of Labor Statistics. The PPI measures prices that domestic producers receive for their goods and services; this differs from the Consumer Price Index which measures what consumers pay and includes both domestic products as well as imports.

The inputs to the New Residential Construction Price Index grew 1.9% from May of last year. The index can be broken into two components­—the goods component increased 1.6% over the year, with services increasing 2.3%. For comparison, the total final demand index, which measures all goods and services across the economy, increased 2.6% over the year, with final demand with respect to goods up 1.3% and final demand for services up 3.2% over the year.

Input Goods

The goods component has a larger importance to the total residential construction inputs price index, representing around 60%. For the month, the price of input goods to new residential construction was up 0.1% in May.

The input goods to residential construction index can be further broken down into two separate components, one measuring energy inputs with the other measuring remaining goods. The latter of these two components simply represents building materials used in residential construction, which makes up around 93% of the goods index.

Energy input prices were up 0.8% between April and May but were 9.8% lower than one year ago. Building material prices were up 0.1% between April and May while up 2.5% compared to one year ago. Across building material inputs, the commodity with the largest monthly increase in May was parts for construction machinery and equipment, which increased 6.8% after increasing 8.4% in April.

Input Services

Prices for service inputs to residential construction reported an increase of 0.3% in May. On a year-over-year basis, service input prices are up 2.3%. The price index for service inputs to residential construction can be broken out into three separate components: a trade services component, a transportation and warehousing services component, and a services excluding trade, transportation and warehousing component (other services). The most significant component is trade services (around 60%), followed by other services (around 29%), and finally transportation and warehousing services (around 11%). The largest component, trade services, was up 2.9% from a year ago. The other services component was up 1.4% over the year.  Lastly, prices for transportation and warehousing services advanced 1.8% compared to May of last year.

Inputs to New Construction Satellite Data

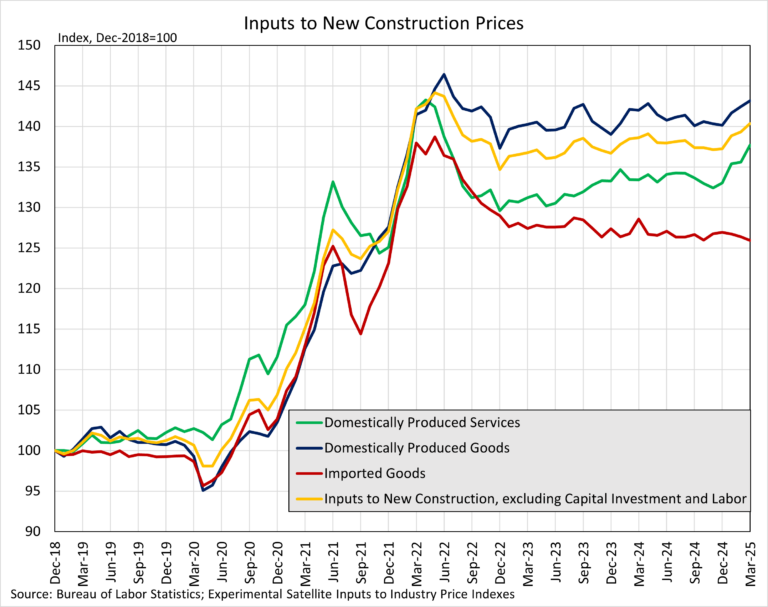
Within the PPI that BLS publishes, new experimental data was recently published regarding inputs to new construction. The data expands existing inputs to industry indexes by incorporating import prices with prices for domestically produced goods and services. With this additional data, users can track how industry input costs are changing among domestically produced products and imported products. This data focuses on new construction, but the complete dataset includes indices across numerous industries, found here.

New Construction input prices are primarily influenced by domestically produced goods and services, with domestic products accounting for 90% of the weight of the industry index for new construction. Imported goods make up the remaining 10% of the index. The latest available data, for March 2025, showed that domestically produced goods have experienced faster price growth compared to imported goods used in new construction. On a year-over-year basis, the index for domestic goods increased 0.8%, while prices for imported inputs fell 2.1% over the same period. Across all inputs to new construction, services prices have risen more than good inputs over the past year, as domestic services prices rose 2.2%. Across the three indexes, all inputs remain at higher levels compared to pre-pandemic prices.

Discover more from Eye On Housing

Subscribe to get the latest posts sent to your email.


This article was originally published by a eyeonhousing.org . Read the Original article here. .


Private residential construction spending fell by 0.9% in April, marking the third consecutive monthly decline. This decrease was primarily driven by reduced spending in single-family construction and home improvements. Compared to a year ago, total spending was down 4.8%, as the housing sector continues to navigate the economic uncertainty stemming from ongoing tariff concerns and elevated mortgage rates.

According to the latest U.S. Census Construction Spending data, single-family construction spending declined by 1.1% in April. This decrease aligns with the weakness in the April single-family starts and NAHB/Wells Fargo Housing Market Index (HMI). The April data ends seven months of growth in single-family construction spending, making it 2.2% lower than a year ago. Meanwhile improvement spending was down 0.8% in April and was 5.5% lower on a year-over-year basis. Multifamily construction spending edged down 0.1% in April, staying in the downward trend that began in December 2023. Compared to April 2024, multifamily spending was down 11.3%.

The NAHB construction spending index is shown in the graph below. The index illustrates how   spending on single-family construction has slowed since early 2024 under the pressure of elevated interest rates and concerns over building material tariffs. Multifamily construction spending growth has also slowed down after the peak in July 2023. Improvement spending has also been weakening since the beginning of 2025.

Spending on private nonresidential construction was up 1% over a year ago. The annual private nonresidential spending increase was mainly due to higher spending for the class of power ($7.9 billion), followed by the office category ($3.3 billion).

Discover more from Eye On Housing

Subscribe to get the latest posts sent to your email.


This article was originally published by a eyeonhousing.org . Read the Original article here. .


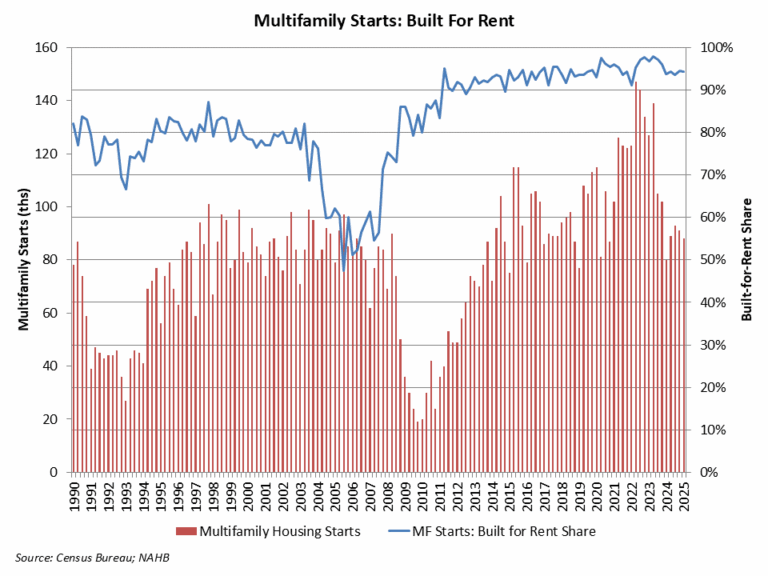
According to NAHB analysis of quarterly Census data, the count of multifamily, for-rent housing starts increased during the first quarter of 2025. For the quarter, 88,000 multifamily residences started construction. Of this total, 83,000 were built-for-rent. This was almost 11% higher than the first quarter of 2024.

The market share of rental units of multifamily construction starts was 94% for the first quarter. A historical low market share of 47% for bult-for-rent multifamily construction was set during the third quarter of 2005, during the condo building boom. An average share of 80% was registered during the 1980-2002 period.

For the first quarter, there were 5,000 multifamily condo unit construction starts, flat from a year ago.

An elevated rental share of multifamily construction is holding typical apartment size below levels seen during the pre-Great Recession period. However, according to the first quarter 2025 data, the average square footage of multifamily construction starts fell back to 1,027 square feet. The median declined to 1,027 square feet.

Discover more from Eye On Housing

Subscribe to get the latest posts sent to your email.


This article was originally published by a eyeonhousing.org . Read the Original article here. .


The missing middle construction sector includes development of medium-density housing, such as townhouses, duplexes and other small multifamily properties.

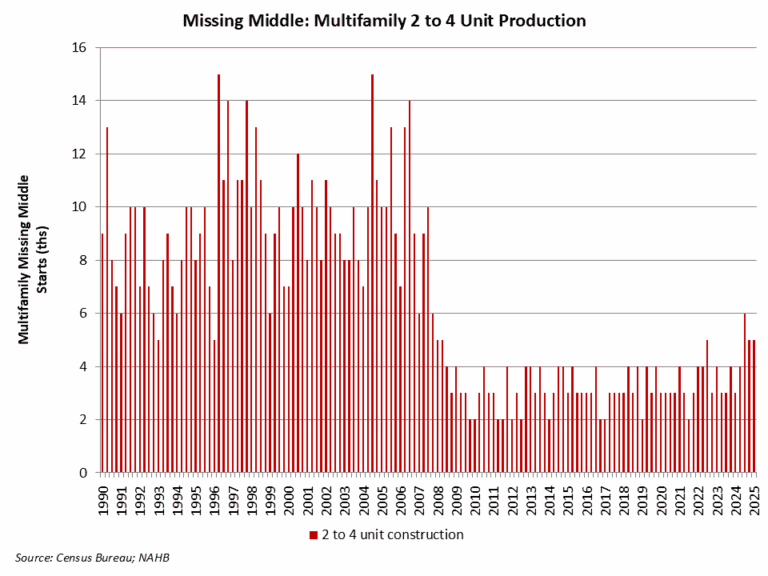
The multifamily segment of the missing middle (apartments in 2- to 4-unit properties) has generally disappointed since the Great Recession. However, there has been a noticeable uptick for this type of housing construction in recent data. For the first quarter of 2025, there were 5,000 2- to 4-unit housing unit construction starts. This is flat relative to the first quarter of 2024.

However, over the last four quarters this type of construction totaled 23,000 units, up 53% over the four quarters prior to that period.

As a share of all multifamily production, 2- to 4-unit development was just above 6% of total multifamily development for the first quarter. However this is still lower than recent historic trends. From 2000 to 2010, such home construction made up a little less than 11% of total multifamily construction.

Construction of the missing middle has clearly lagged during the post-Great Recession period and will continue to do so without zoning reform focused on light-touch density. But recent data offer hope for additional housing supply for these kind of homes.

Discover more from Eye On Housing

Subscribe to get the latest posts sent to your email.


This article was originally published by a eyeonhousing.org . Read the Original article here. .


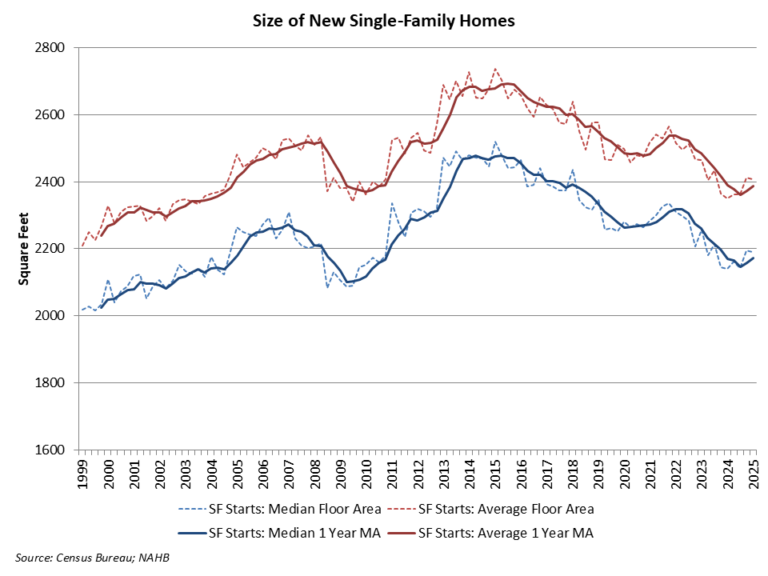
An expected impact of the virus crisis was a need for more residential space, as people used homes for more purposes including work. Home size correspondingly increased in 2021 as interest rates reached historic lows. However, as interest rates increased in 2022 and 2023, and housing affordability worsened, the demand for home size has trended lower.

According to first quarter 2025 data from the Census Quarterly Starts and Completions by Purpose and Design and NAHB analysis, median single-family square floor area was 2,190 square feet, near the highest reading since mid-2023. Average (mean) square footage for new single-family homes registered at 2,408 square feet.

The average size of a new single-family home, on a one-year moving average basis, trended higher to 2,386 square feet, while the median size is at 2,172 square feet.

Home size increased from 2009 to 2015 as entry-level new construction lost market share. Home size declined between 2016 and 2020 as more starter homes were developed. After a brief increase during the post-COVID building boom, home size has trended lower due to declining affordability conditions.

Discover more from Eye On Housing

Subscribe to get the latest posts sent to your email.


This article was originally published by a eyeonhousing.org . Read the Original article here. .

Pin It