Tag

Communities

Browsing


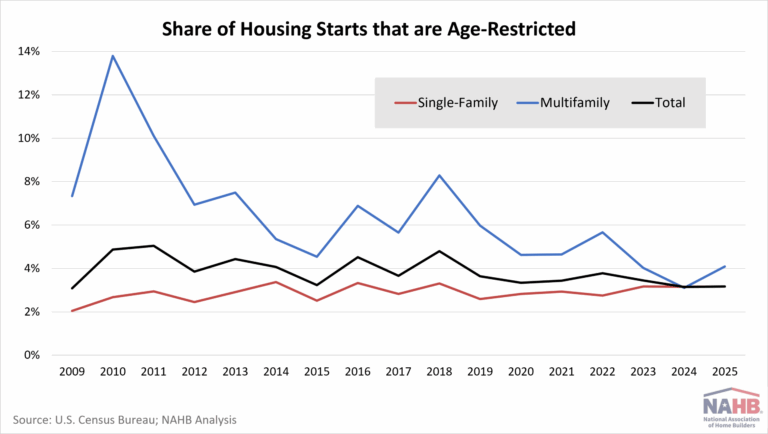
In 2025, approximately 47,000 homes were built in age-restricted communities, representing 3.45% of all housing starts. According to the Census Bureau’s Survey of Construction, roughly two-thirds of these homes (30,000) were single-family units, while the remaining 17,000 were multifamily units. 

In 2009, during the depths of the housing downturn, builders started only 17,000 homes in age-restricted communities. The volume of construction increased steadily until reaching 60,000 age-restricted starts (roughly evenly split between single-family and multifamily) in 2018. Starts declined during the pandemic but rebounded in 2021 and 2022. Since then, age-restricted construction has fallen along with the broader decline in overall housing starts. 

Age-restricted single-family homes accounted for 3.16% of all single-family housing starts in 2025, unchanged from the previous two years. This share has remained relatively stable since 2009. In contrast, the share of age-restricted multifamily units increased from 3.11% in 2024 to 4.09% in 2025. Even with this increase, the current multifamily share remains well below its peak of roughly 14% in 2010. 

Age-restricted single-family homes carried a noticeable price premium in 2025. The median sales price reached $523,000, about 27% higher than the $412,000 median for non-age-restricted homes. Age-restricted homes tend to be larger, averaging 2,500 square feet versus 2,100 square feet. However, the price per square foot remained elevated at $166.20, compared to $153.30 for non-age-restricted homes. 

Lot values may help explain part of the price difference. Age-restricted homes were typically built on more expensive lots, with a median value of $64,000 compared to $60,000 for non-age-restricted homes. Despite the higher price, these lots were slightly smaller, averaging 0.19 acres versus 0.20 acres. 


This article was originally published by a eyeonhousing.org . Read the Original article here. .
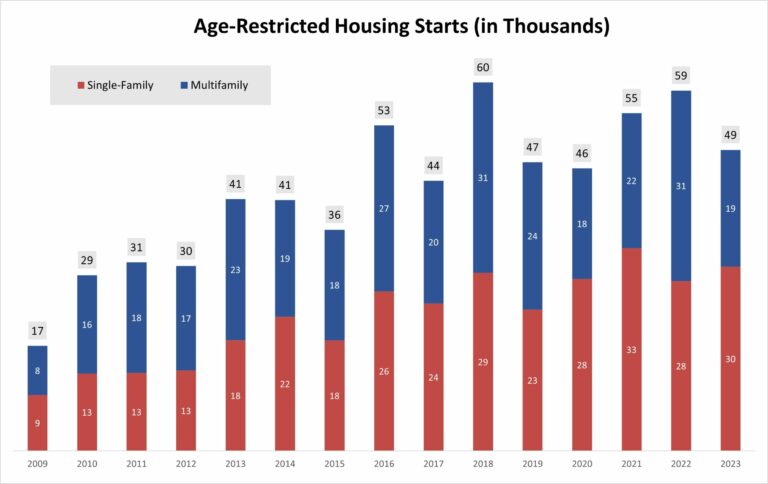

Of the roughly 950,000 single-family and 470,000 multifamily homes that started construction in 2023, 49,000 (30,000 single-family and 19,000 multifamily) were built in age-restricted communities, according to NAHB tabulation of data from the Census’s Survey of Construction. A residential community can be legally age-restricted, provided it conforms to one of the set of rules specified in the Housing for Older Persons Act of 1995. 

NAHB was first successful in persuading HUD and the Census Bureau to collect and publish data on the age-restricted status of new homes in 2009, during the depths of the housing downturn. In 2009, builders started only 17,000 homes in age-restricted communities (9,000 single-family and 8,000 multifamily).  The numbers then increased steadily until reaching 60,000 age-restricted starts (roughly evenly split between single-family and multifamily) in 2018. These numbers fell during the pandemic but rebounded in 2021-2022, almost reaching the peak from 2018.  

In 2023, the total number of age-restricted home starts decreased by approximately 17% from 2022, down to 49,000. Overall, housing starts were lower than the previous year, with single-family and multifamily starts dropping by about 6% and 14%, respectively. However, age-restricted home starts showed a mixed trend: they increased for single-family homes but declined for multifamily homes. This shift was due to a higher percentage of single-family home starts being age-restricted compared to the previous year, while a lower percentage of multi-family home starts fell into this category. 

The SOC data allow for a comparison of the characteristics of new age-restricted single-family homes with other single-family homes started in 2023. The analysis reveals that age-restricted homes were more expensive, with a median price of $500,000, compared to $422,000 for non-age-restricted homes. This follows a similar tendency observed in 2022, when age-restricted homes had a median price of $547,000, compared to $461,000 for non-age-restricted homes.

However, in 2022, the median size was the same for both types of homes, making age-restricted homes more expensive per square foot. In 2023, on the other hand, the median size was 200 square feet larger for age-restricted homes, resulting in the same median price per square foot for both types of homes at $152.63. A difference was also apparent in lot value. Although the median lot size was the same for age-restricted and non-age-restricted lots (0.2 acres), the median value for age-restricted lots was $50,000 compared to $60,000 for non-age-restricted lots.

Additional data from the 2023 SOC reveal that age-restricted homes have distinct characteristics compared to non-age-restricted homes. A higher percentage of age-restricted homes are attached, single-story, and lack a basement. These homes are also more likely to come with patios and porches, but less likely to have decks.  Finally, age-restricted homes are less likely to require a loan and more likely to be purchased for cash, as home buyers who are older have had more of a chance to accumulate the savings and assets (often equity in a previous home) that can be converted to cash.

Discover more from Eye On Housing

Subscribe to get the latest posts sent to your email.


This article was originally published by a eyeonhousing.org . Read the Original article here. .

Pin It