Tag

Characteristics

Browsing


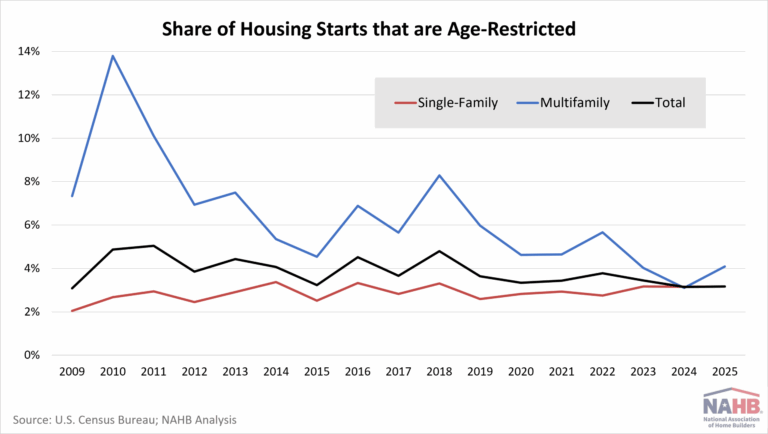
In 2025, approximately 47,000 homes were built in age-restricted communities, representing 3.45% of all housing starts. According to the Census Bureau’s Survey of Construction, roughly two-thirds of these homes (30,000) were single-family units, while the remaining 17,000 were multifamily units. 

In 2009, during the depths of the housing downturn, builders started only 17,000 homes in age-restricted communities. The volume of construction increased steadily until reaching 60,000 age-restricted starts (roughly evenly split between single-family and multifamily) in 2018. Starts declined during the pandemic but rebounded in 2021 and 2022. Since then, age-restricted construction has fallen along with the broader decline in overall housing starts. 

Age-restricted single-family homes accounted for 3.16% of all single-family housing starts in 2025, unchanged from the previous two years. This share has remained relatively stable since 2009. In contrast, the share of age-restricted multifamily units increased from 3.11% in 2024 to 4.09% in 2025. Even with this increase, the current multifamily share remains well below its peak of roughly 14% in 2010. 

Age-restricted single-family homes carried a noticeable price premium in 2025. The median sales price reached $523,000, about 27% higher than the $412,000 median for non-age-restricted homes. Age-restricted homes tend to be larger, averaging 2,500 square feet versus 2,100 square feet. However, the price per square foot remained elevated at $166.20, compared to $153.30 for non-age-restricted homes. 

Lot values may help explain part of the price difference. Age-restricted homes were typically built on more expensive lots, with a median value of $64,000 compared to $60,000 for non-age-restricted homes. Despite the higher price, these lots were slightly smaller, averaging 0.19 acres versus 0.20 acres. 


This article was originally published by a eyeonhousing.org . Read the Original article here. .

New manufactured homes saw a decline in shipments in 2023 compared to the previous year. According to the Manufactured Housing Survey (MHS), 89,169 manufactured homes were shipped in 2023, a decrease of 21% from the 112,882 homes shipped in 2022. The Census defines a manufactured home as a movable dwelling, 8 feet or more wide and 40 feet or more long, designed to be towed on its own chassis, with transportation gear integral to the unit when it leaves the factory, and without need of a permanent foundation. No building permit is required for a manufactured home.

Despite the 2023 decline, the ratio of shipments to new single-family site-built home construction starts remained consistent between 1 to 9 and 1 to 10. In 2023, that number was 1 to 10, meaning that for every new manufactured home shipped, 10 new single-family site-built homes started construction. Of the total 2023 shipments, 35.7% (31,830 homes) were either sold or leased, while 2022 saw 46,696 (49%) being sold or leased.

Regionally, the South continued to receive the majority of shipments at 66%. The Midwest followed with 14%, the West with 11%, and the Northeast with 6%. Texas remained the leading state for shipments, accounting for 15,073 homes, which represents 17% of the total. Altogether, the top ten states comprised over 60% of the shipment share, highlighting a concentrated market presence.

Breaking down the types of manufactured homes shipped, 45% were single-section units. These homes had an average sales price of $84,800 and an average area of 1,038 square feet, translating to a price of $81.70 per square foot. In contrast, 54% of the shipments were multi-section homes, with an average sales price of $154,100 and a larger area of 1,748 square feet, equating to $88.16 per square foot. When compared to new single-family site-built homes started in 2023, which had an average price of $165.94 per square foot (excluding land value), multi-section manufactured homes are approximately 1.9 times less expensive per square foot.

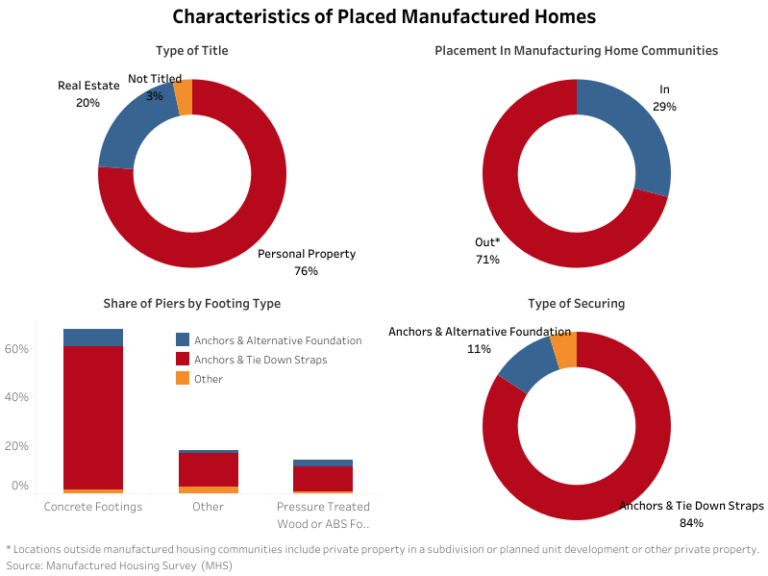
Out of the total homes shipped, 70% (59,950 homes) were placed at their final destinations. Among the placed homes, 21% were titled as real estate property, while the majority, 76%, were classified as personal property. Additionally, only 29% of the placed homes were situated within a manufactured housing community. Census doesn’t have an official definition of a manufactured housing community, but as an example of the industry’s term of art, Law Insider defines it as “any area where two or more manufactured home lots are leased specifically for the use of manufactured homes”.

Looking into other characteristics of placed manufactured homes, over half (57%) had concrete footings. Pressure-treated wood and monolithic-slab foundations comprised 12% each, and basement or crawl space foundations was 4%. For homes not placed on concrete or slab foundations, the most common type of pier is concrete block (77%) while the majority (84%) were secured using anchors and tie-down straps, and 11% utilizing anchors and alternative foundations.

Discover more from Eye On Housing

Subscribe to get the latest posts sent to your email.


This article was originally published by a eyeonhousing.org . Read the Original article here. .

Pin It