Tag

Building

Browsing


Approximately 27% of the national housing stock consists of multifamily homes—defined as residential buildings with multiple separate housing units within one structure. According to the 2023 American Community Survey 1-year estimates, these units range from small duplexes, triplexes, and quadplexes (2 to 4 units) to medium-sized buildings (5 to 49 units) and large complexes (50 or more units).

While most congressional districts have multifamily housing shares between 10% to 20% of total housing units, this proportion varies widely, from as low as 8% to as high as 98%. The map below illustrates the distribution of multifamily housing stock across congressional districts with larger shares indicated by bigger bubble size. This visualization shows that districts with the largest share of multifamily units are, unsurprisingly, concentrated in densely populated urban areas.

New York leads in this regard, with its 12th and 13th Districts – both encompassing upper and midtown Manhattan – having almost exclusively multifamily units at 98% each. In fact, eight out of the top 10 districts with the largest share of multifamily housing are in New York. Other areas with large shares include New Jersey’s 8th District, also within the New York metropolitan area, and Massachusetts’s 7th District that includes Boston. At the lower end of the distribution, North Carolina’s 8th District has only 8% multifamily units, while Michigan’s 2nd and 9th Districts, Arizona’s 9th District, and Florida’s 12th District all have around 9% multifamily units.

Building Sizes in Multifamily Units

In most congressional districts, multifamily units tend to be on the smaller side, with the majority consisting of buildings with 5 to 19 units, followed by those with 2 to 4 units. Duplexes, triplexes, and quadplexes (2 to 4 units) are especially common in the Northeast, various Mountain states, and parts of California. Apart from Illinois’s 4th District, which has the highest share of small multifamily units (70%), the remaining top five districts with the largest shares of 2 to 4 unit buildings are all in New York, each exceeding 60%.

Buildings with 5 to 19 units are more prevalent across the South and Midwest, with Maryland’s 2nd, 3rd and 4th Districts owning majority shares of this building type with 59%, 62% and 61%, respectively. High-density areas like New York’s 12th District, Florida’s 27th District – located within Miami-Dade County – and Washington, D.C. (at large), tend to have the largest multifamily (50 or more) buildings. North Dakota (at large) and Minnesota’s 6th District stand out as the only two congressional districts where the majority of multifamily buildings have between 20 to 49 multifamily units.

Gross Median Rent and Renter Cost Burden

Multifamily units are predominantly rented rather than owned, with 86% being occupied by renters. This trend holds across all multifamily types, with larger buildings generally more likely to be rental properties, while condominiums (owner-occupied units) are often smaller buildings. A Fannie Mae study on the multifamily market found that larger properties typically command higher monthly rents, especially in major metropolitan areas. The chart below corroborates this, showing that districts with higher shares of large multifamily buildings (50 or more units) also have higher median monthly rents (including utilities and fuel). However, lower median rents don’t always equate to more affordability, as even low-rent areas can have high renter cost burdens due to lower income levels. For example, New York’s 12th District has the highest median rent at $3,121, with 43% of renters burdened (spending over 30% of income on housing costs), a rate matched by Kentucky’s 5th District, where the median rent is only $727. Overall, despite rent prices moderating (see Real Rent Index), rental cost burdens remain high across the country, with only 23 of 436 congressional districts (including D.C.) having fewer than 40% of renter households burdened by housing costs.

Additional housing data for your congressional district are provided by the US Census Bureau here.

Discover more from Eye On Housing

Subscribe to get the latest posts sent to your email.


This article was originally published by a
eyeonhousing.org . Read the Original article here. .


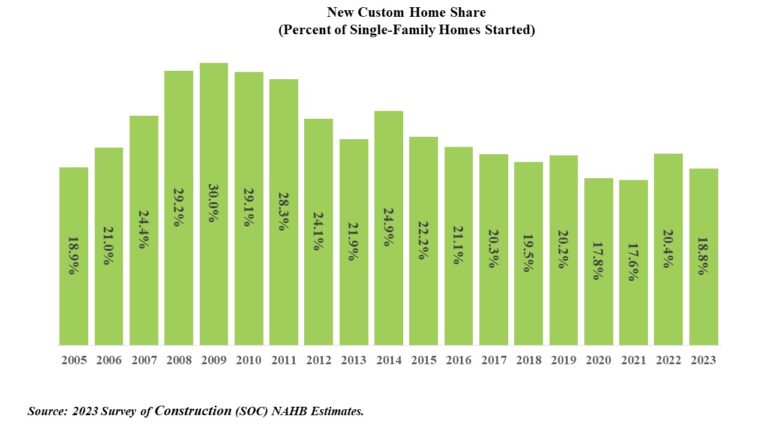
In 2023, 18.8 percent of all new single-family homes started were custom homes. This share decreased from the 20.4 percent recorded in 2022, according to data tabulated from the Census Bureau’s Survey of Construction (SOC). The custom home market consists of contractor-built and owner-built homes—homes built one at a time for owner occupancy on the owner’s land, with either the owner or a builder acting as a general contractor. The alternatives are homes built-for-sale (on the builder’s land, often in subdivisions, with the intention of selling the house and land in one transaction) and homes built-for-rent.   

In 2023, 71.5 percent of the single-family homes started were built-for-sale, and 9.7 percent were built-for-rent. At an 18.9 percent share, the number of custom homes started in 2023 was 177,850, falling from 207,472 in 2022. 

The quarterly published statistics show that the custom home share of single-family starts showed gains in the second quarter of 2024 after some recent slowing. Although the quarterly statistics are timelier, they lack the geographic detail available in the annual data set.

When analyzed across the 9 census divisions, the annual data show that the highest custom home share in 2023 was 35.5 percent in the East South-Central division. While the lowest share was in the West South-Central division, where the share was only 11.9 percent. The share of custom homes across U.S. divisions are showed in the map below.

Discover more from Eye On Housing

Subscribe to get the latest posts sent to your email.


This article was originally published by a eyeonhousing.org . Read the Original article here. .


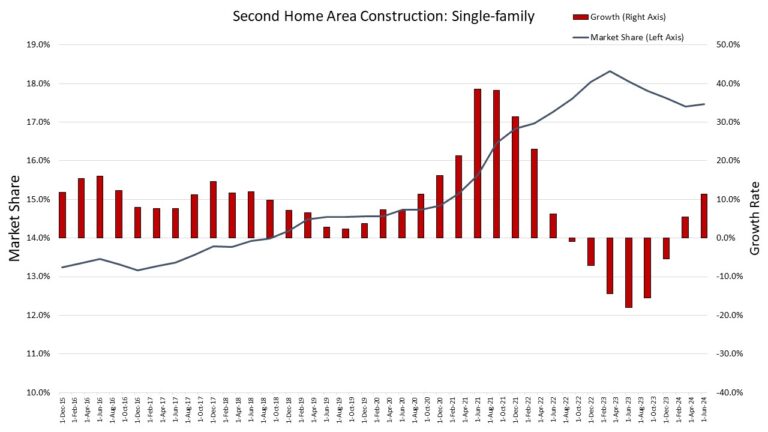
NAHB’s featured topic for the second quarter HBGI reveals that 17.5% of single-family and 8.6% of multifamily construction takes place in second home areas. Recent NAHB analysis found that the total count of second homes across the US was 6.5 million, which accounts for 4.6% of the total housing stock. For this analysis, a second home area is a county that has a second home share greater than 10.3% of the county’s total housing stock (these counties fall within the 75th and above percentile of the second home stock share distribution).  There are 788 counties that are considered a second home area based on this definition.

Single-family

Single-family permit data shows that the market share for construction in second home areas has grown by over four percentage points in the past nine years. The earliest data, which is the fourth quarter of 2015, shows that second home areas had a market share of 13.2%. As of the second quarter of 2024, the market share for this geography increased to 17.5%. However, this latest reading is down from a peak of 18.3% in the first quarter of 2023.  

The peak growth rate in construction for second homes areas was at 38.5% in the third quarter of 2021. The first recorded decline in the growth rate occurred in the third quarter of 2022. This downward growth rate was followed by five quarters of declines until the first quarter of 2024.   Second home areas have averaged a growth rate of 9.1% between the fourth quarter of 2015 and the second quarter of 2024, while non-second home areas averaged single-family a growth rate of 5.1% over the same period.  

Multifamily

Although smaller, the market share for second home areas has also grown for multifamily construction. The market share was 5.5% in the fourth quarter of 2015 and is now 8.6%, a 3.1 percentage point increase. This increase in market share has been more volatile than single-family, as growth in construction has not been as consistent for multifamily in second home areas. 

There have been three periods where construction growth for multifamily experienced declines in these areas, such as in 2017 and early 2021. The third period of decline is ongoing, as there have been two consecutive quarters where the growth rate has been negative to start 2024. The latest growth rate is a11.8% decline. This is down from a peak of 53.1% in the third quarter of 2022, as multifamily construction has slowed nationwide. 

Discover more from Eye On Housing

Subscribe to get the latest posts sent to your email.


This article was originally published by a eyeonhousing.org . Read the Original article here. .


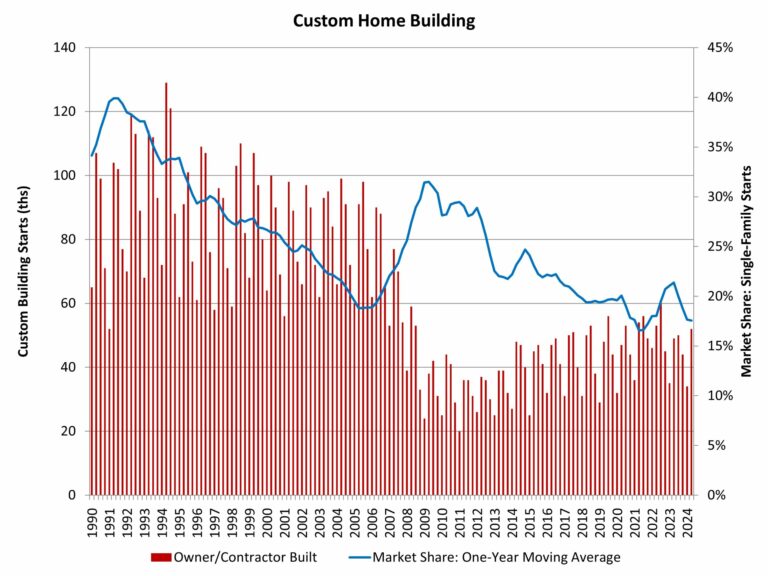
NAHB’s analysis of Census Data from the Quarterly Starts and Completions by Purpose and Design survey indicates gains for custom home building after some recent slowing. Custom home building typically involves home buyers less sensitive to changes for interest rates.

There were 52,000 total custom building starts during the second quarter of 2024. This marks an almost 6% increase compared to the second quarter of 2023 and the best reading since the third quarter of 2022. Over the last four quarters, custom housing starts totaled 180,000 homes, a 5% decline compared to the prior four quarter total (189,000) due to weakness in prior quarters.

After share declines due to a rise in spec building in the wake of the pandemic, the market share for custom homes increased until 2023 and then entered a period of retrenchment. As measured on a one-year moving average, the market share of custom home building, in terms of total single-family starts, has fallen back to just under 18%. This is down from a prior cycle peak of 31.5% set during the second quarter of 2009 and a 21% local peak rate at the beginning of 2023.

Note that this definition of custom home building does not include homes intended for sale, so the analysis in this post uses a narrow definition of the sector. It represents home construction undertaken on a contract basis for which the builder does not hold tax basis in the structure during construction.

Discover more from Eye On Housing

Subscribe to get the latest posts sent to your email.


This article was originally published by a eyeonhousing.org . Read the Original article here. .


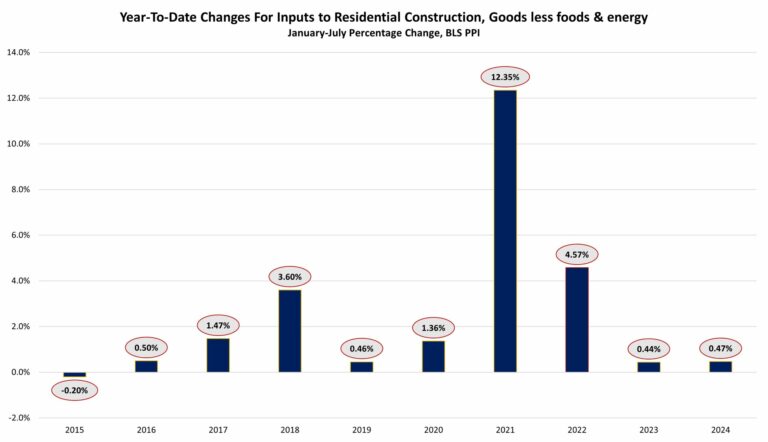
Inputs to residential construction, goods less foods and energy, decreased 0.04% over July according to the most recent Producer Price Index (PPI) report published by the U.S. Bureau of Labor Statistics (BLS). The index for inputs to residential construction, goods less food and energy, represents building materials used in residential construction. Compared to a year ago, the index is up 2.01% in July, marking the sixth straight month of above 2% growth.

Just past the midpoint of 2024, the year-to-date (YTD) increase in the index is at 0.47%. This is slightly higher yet similar to the YTD growth rate for 2023, which was 0.44%.

The seasonally adjusted PPI for final demand goods increased 0.62% in July, after decreasing a revised 0.36% in June. In July, the PPI for final demand energy increased 1.90%, final demand food also rose 0.61% and final demand goods, less food and energy, rose 0.24%. The BLS producer price indices measure the average change in selling prices that domestic producers receive for their output.

The seasonally adjusted PPI for softwood lumber fell 1.04% in July after rising 3.29% in June. Softwood lumber prices were 13.12% lower than July 2023.

The non-seasonally adjusted PPI for gypsum building materials increased 0.08% in July after no increase in June. Compared to last year, the index was up 4.25%, the highest yearly increase since April 2023 when the index was up 12.14%.

The seasonally adjusted PPI for ready-mix concrete rose 0.03% in July after falling 0.15% in June. Monthly growth in prices for read-mix concrete has been relatively flat for four consecutive months after prices peaked in March. Over the year, ready-mix concrete prices were 5.05% higher than July 2023.

The non-seasonally adjusted PPI for steel mill products fell for the second straight month, down 3.29% in July. Steel mill product prices are 13.99% lower than last year. Overall, steel mill product prices have fallen 36.99% since peaking back December of 2021.

The non-seasonally adjusted special commodity grouping PPI for copper rose 0.56% in July after falling 2.79% in June. Over the year, the index was up 14.26%. This special commodity grouping of copper includes the following commodities: copper and nickel ores, copper cathode and refined copper, copper base scrap, secondary copper (alloyed and unalloyed), copper and brass mill shapes, copper wire and cable, and copper base castings (excluding die-castings).

Discover more from Eye On Housing

Subscribe to get the latest posts sent to your email.


This article was originally published by a eyeonhousing.org . Read the Original article here. .


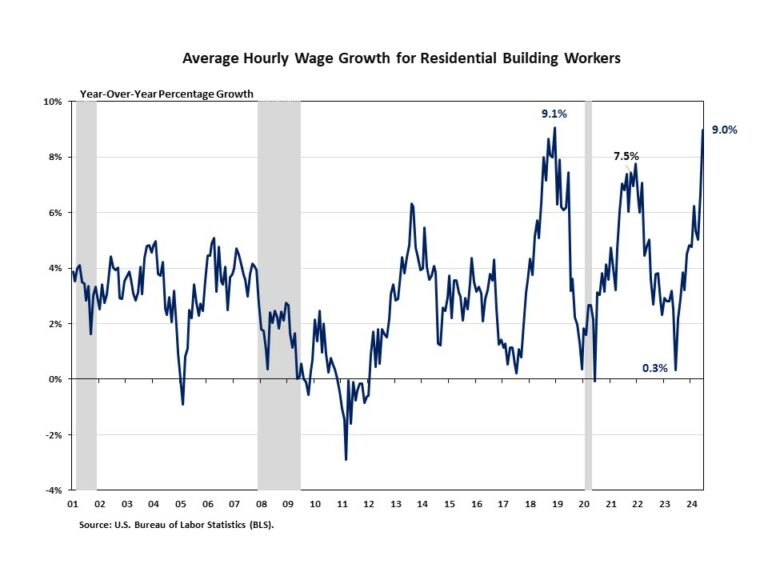
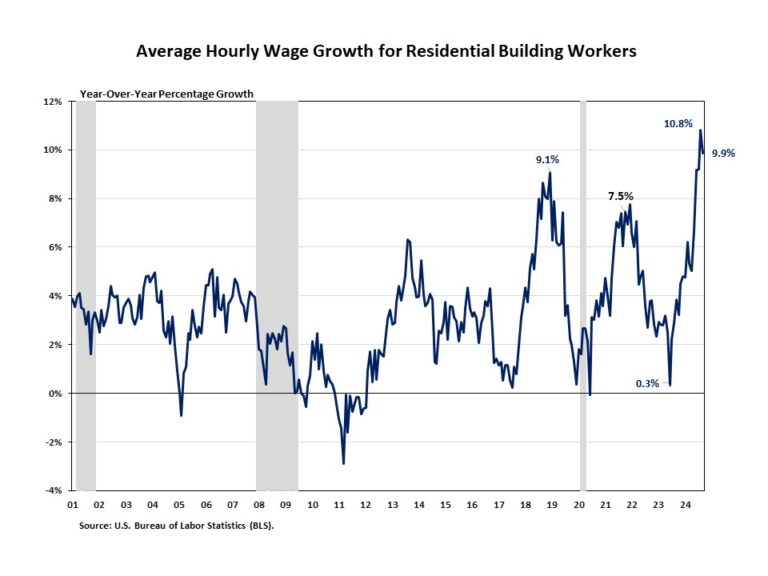
Residential building workers’ wage growth accelerated to 9.0% in June. This marks the fastest year-over-year (YOY) growth rate since December 2018. After a 0.3% increase in June 2023, the YOY growth rate for residential building worker wages have been trending upward over the past year.

The ongoing skilled labor shortage in the construction labor market and lingering inflation impacts account for the recent acceleration in wage growth. However, demand for construction labor is weakening as interest rates remain elevated. As mentioned in the latest JOLTS blog, the number of open construction sector jobs shifted notably lower from 366,000 in May to 295,000 in June. Nonetheless, the ongoing skilled labor shortage continues to challenge the construction sector.

According to the Bureau of Labor Statistics report, average hourly earnings for residential building workers* was $32.28 per hour in June 2024, increasing 9.0% from $29.62 per hour a year ago. This was 16.2% higher than the manufacturing’s average hourly earnings of $27.79 per hour, 10.6% higher than transportation and warehousing ($29.18 per hour), and 11.1% lower than mining and logging ($36.33 per hour).

Note: *Data used in this post relate to production and nonsupervisory workers in the residential building industry. This group accounts for approximately two-thirds of the total employment of the residential building industry.

Discover more from Eye On Housing

Subscribe to get the latest posts sent to your email.


This article was originally published by a eyeonhousing.org . Read the Original article here. .

Pin It