Tag

Building

Browsing


Housing construction activity strengthened in March, with a notable rebound in both single-family and multifamily starts, signaling improved builder activity despite ongoing headwinds from financing costs and affordability constraints. While the monthly gain points to renewed momentum, year-to-date trends remain mixed, particularly in the single-family sector, and permit activity suggests some caution moving forward.

Overall housing starts increased 10.8 percent in March to a seasonally adjusted annual rate of 1.5 million units, according to a report from the U.S. Department of Housing and Urban Development (HUD) and the U.S. Census Bureau. This pace reflects the number of housing units builders would begin over the next 12 months if March’s activity were sustained.

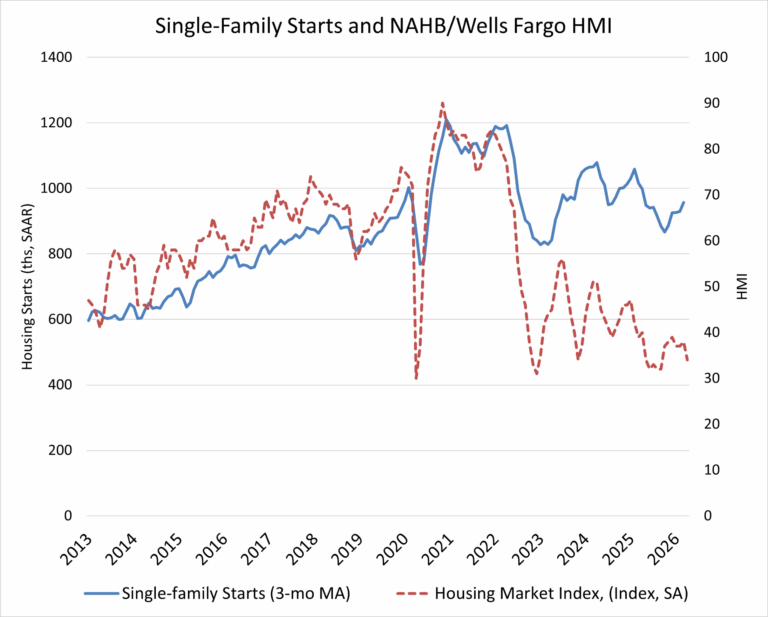
Within the total, single-family starts increased 9.7 percent to a seasonally adjusted annual rate of 1.03 million units and are up 8.9 percent compared to March 2025. On a year-to-date basis, single-family starts are down 5.5 percent. Given recent volatility, the three-month moving average provides a clearer signal, rising to 957,000 units.

Multifamily starts, which include apartment buildings and condominiums, increased 13.3 percent to an annualized 470,000-unit pace and are up 15.5 percent compared to March 2025. The three-month moving average for multifamily construction has trended higher to 462,000 units, and activity is 15.5 percent higher compared to year-ago levels.

Regionally, on a year-to-date basis, combined single-family and multifamily starts were 36 percent higher in the Northeast, 7.8 percent higher in the Midwest, 3.0 percent higher in the South, but 15.5 percent lower in the West.

The total number of housing units under construction stood at 1.3 million in March, down 9.8 percent from a year earlier. Single-family homes under construction stood at 587,000 units, a 7.3 percent year-over-year decline. Multifamily units under construction declined to 677,000, down from peaks above 1 million units in December 2023 and 11.8 percent lower than a year ago.

Completions of single-family homes have slowed down to an annual rate of about 896,000 units, reflecting ongoing challenges in the residential construction sector. This marks a 14.5 percent decline from a year earlier. Multifamily completions for buildings with five or more units followed the same trend, down 9.1 percent year over year to a 452,000-unit pace. On a year-to-date basis, total completions across both sectors are down 13.5 percent.

Overall permits decreased 10.8 percent to a 1.37 million-unit annualized rate in March. Single-family permits decreased 3.8 percent to an 895,000-unit rate and are down 7.9 percent compared to March 2025. Multifamily permits decreased 21.5 percent to an annualized 477,000-unit pace and are down 6.3 percent compared to March 2025. Looking at regional permit data on a year-to-date basis, permits were 15.4 percent higher in the Northeast, 6.0 percent higher in the West, and 1.1 percent higher in the Midwest. However, permits were 9.1 percent lower in the South.


This article was originally published by a eyeonhousing.org . Read the Original article here. .


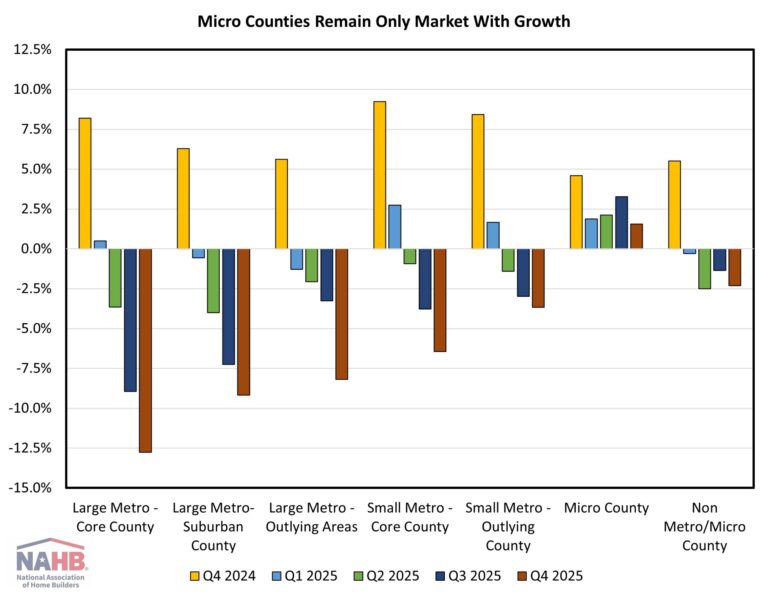
Single-family construction declined further in the fourth quarter in all but sparsely populated micro counties, according to the NAHB Home Building Geography Index (HBGI). Meanwhile, multifamily construction showed growth in all markets for the first time in over two years as it continued to strengthen given the affordability challenges facing for-sale construction. The HBGI tracks single-family and multifamily permits across seven population density delineated geographies in the United States.

Single-Family

Among the HBGI markets, growth in the fourth quarter of 2025 was only registered in micro counties, which increased 1.6% year-over-year on a four-quarter moving average basis (4QMA). This was the seventh consecutive quarter where micro counties showed growth. All other markets reported declines, with the largest occurring in large metro core counties, posting a decline of 12.8%. All markets showed growth one year ago which quickly dissipated as 2025 presented a host of challenges for builders, ranging from the ongoing affordability crisis to economic uncertainty.

In terms of market share, single-family construction’s largest geography remained small metro core county areas, representing 29.4%.. The smallest single-family construction market remained non metro/micro county areas, with a 4.5% market share. The largest decline in market share over 2025 was in large metro core counties, falling one percentage point to 15.1%. The largest gain over the year was in small metro outlying counties as the market share rose from 10.0% to 10.5%.

Multifamily

Matching single-family, the largest gains for multifamily construction occurred in micro counties, growing 14.0% (4QMA) in the fourth quarter. This was followed by small metro outlying counties which grew 11.6%. The lowest growth was in large metro outlying counties at 1.9%. This quarter marks the first time that all markets showed growth since the first quarter of 2023.

In terms of market share, large metro core counties held the largest at 35.1%. The market share for large metro core counties rose significantly over the course of 2025, as it was 33.3% in the first quarter. The area that lost the most market share over the year was large metro outlying counties, falling from 4.7% to 3.7% in the fourth quarter.

The fourth quarter of 2025 HBGI data along with an interactive HBGI map can be found at https://nahb.org/hbgi.


This article was originally published by a eyeonhousing.org . Read the Original article here. .


Residential building material price growth accelerated in February after slowing a month prior, according to the latest Producer Price Index release from the Bureau of Labor Statistics. Since the BLS collects pricing data during the week of the 13th, these figures were finalized before the onset of the conflict in Iran.

The Producer Price Index for final demand increased 0.7% in February, after rising 0.5% in January. The index for final demand services rose 0.5% in February, while the index for final demand goods rose 1.1% over the month. The monthly increase in the index for final demand goods was the largest since it rose 1.6% back in August of 2023.

The price index for inputs to new residential construction rose 0.7% in February and was up 3.4% from last year. The price of goods used in new residential construction was up 1.1% over the month and 3.0% from last year, while the price of services was up 0.1% over the month and up 4.2% from last year.

Input Goods

The goods component has a larger importance to the inputs to residential construction price index, representing around 60%. On a monthly basis, the price of input goods to new residential construction was up 1.1% in February. The last time this index increased over 1.0% on a monthly basis was January of 2025.

The input goods to residential construction index can be further broken down into two separate components, one measuring energy inputs with the other measuring remaining goods. The latter of these two components simply represents building materials used in residential construction, which makes up around 93% of the goods index.

Energy input prices rose 9.3% in February but were 3.5% lower than one year ago. Building material prices were up 0.6% in February and up 3.5% compared to one year ago.

The largest year-over-year price increases continue to show in metal products with the largest being for metal molding and trim, as prices are now up 61.7% from a year ago. Metal windows price growth has continued to accelerate with prices up 20.2% from last year. Across all metals and metal products, prices are up 16.6% from last year. Yearly price declines were prevalent among energy products, due to the timing of the survey. For building materials, particleboard and fiberboard prices were down 17.4%, while softwood veneer and plywood prices were down 4.0%.

Input Services

Prices for service inputs to residential construction reported an increase of 0.1% in February. On a year-over-year basis, service input prices were up 4.2%. The price index for service inputs to residential construction can be broken out into three separate components: a trade services component, a transportation and warehousing services component, and a services excluding trade, transportation, and warehousing component (other services).

The most significant component is trade services (around 60%), followed by other services (around 29%), and finally transportation and warehousing services (around 11%). The largest component, trade services, was up 5.8% from a year ago. The transportation and warehousing services rose 3.0%, while prices for other services were up 1.3% over the year.

Expanded Inputs to New Construction Data

Within the PPI that BLS publishes, new experimental data was recently published regarding inputs to new construction. The data expands existing inputs to industry indexes by incorporating import prices with prices for domestically produced goods and services. With this additional data, users can track how industry input costs are changing among domestically produced products and imported products. This data focuses on new construction, but the complete dataset includes indices across numerous industries that can be found here on BLS website.

New construction input prices are primarily influenced by domestically produced goods and services, with domestic products accounting for 90% of the weight of the industry index for new construction. Imported goods make up the remaining 10% of the index.

The latest available data, for December 2025, showed that domestically produced goods continue to show price growth compared to imported goods used in new construction. On a year-over-year basis, the index for domestic goods increased 3.0%, while prices for imported goods have fallen 3.2%.


This article was originally published by a eyeonhousing.org . Read the Original article here. .


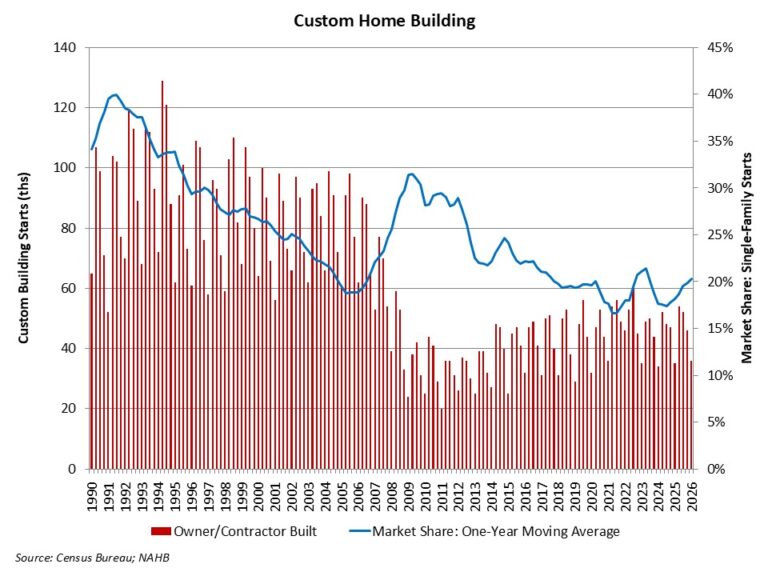
In a year that saw a more than 6% decline for overall single-family housing starts, custom home building posted a gain. The custom building market is less sensitive to the interest rate cycle than other forms of home building but is more sensitive to changes in household wealth and stock prices. With spec home building down and the stock market up, custom building expanded its market share.

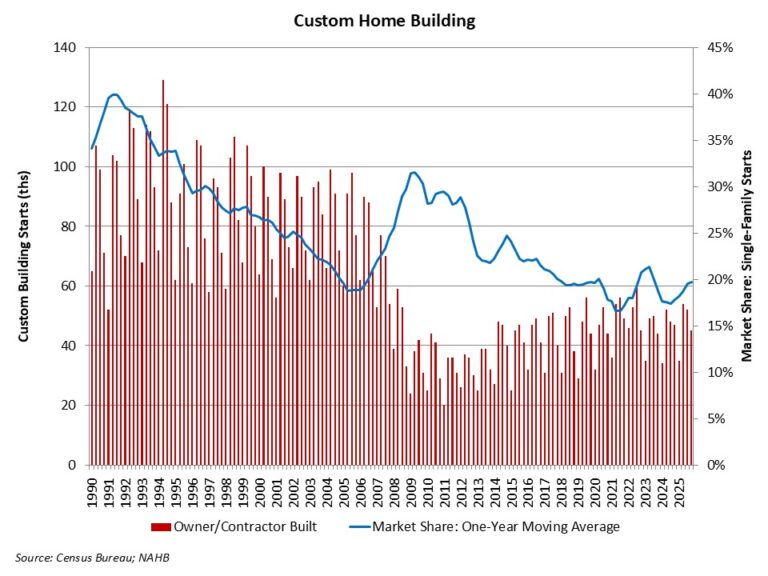
According to NAHB’s analysis of Census data from the Quarterly Starts and Completions by Purpose and Design survey, there were 45,000 total custom building starts during the fourth quarter of 2025. This is down 4% relative to the fourth quarter of 2024.

However, for 2025 as a whole, custom single-family housing starts totaled 186,000 homes, a 3% increase compared to 2024 (181,000).

Currently, the market share of custom home building, based on a one-year moving average, is almost 20% of total single-family starts. This is down from a prior cycle peak of 31.5% set during the second quarter of 2009 and the 21% recent peak rate at the beginning of 2023, after which spec home building gained some market share.

Note that this definition of custom home building does not include homes intended for sale, so the analysis in this post uses a narrow definition of the sector. It represents home construction undertaken on a contract basis for which the builder does not hold tax basis in the structure during construction.


This article was originally published by a eyeonhousing.org . Read the Original article here. .


Residential building material prices rose at a slower rate in January, according to the latest Producer Price Index release from the Bureau of Labor Statistics. This was the first decline in the rate of price growth since April of last year. Metal products continue to experience price increases, while specific wood products are showing declines in prices.

The Producer Price Index for final demand increased 0.5% in January, after rising 0.4% in December. The January increase in final demand is linked directly to final demand services, which saw prices rise 0.8% in January. The index for final demand goods decreased 0.3% in January.

The price index for inputs to new residential construction rose 0.7% in January and was up 3.3% from last year. The price of goods used in new residential construction was up 0.9% over the month and 2.4% from last year. Meanwhile, the price for services was up 0.3% over the month and up 4.7% from last year.

Input Goods

The goods component has a larger importance to the inputs to residential construction price index, representing around 60%. On a monthly basis, the price of input goods to new residential construction was up 0.9% in January.

The input goods to residential construction index can be further broken down into two separate components, one measuring energy inputs with the other measuring remaining goods. The latter of these two components simply represents building materials used in residential construction, which makes up around 93% of the goods index.

Energy input prices fell 0.9% in January and were 10.3% lower than one year ago. Building material prices were up 1.0% in January and up 3.3% compared to one year ago, marking the lowest year-over-year price change since July of last year.

The largest year-over-year price increases continue to show in metal products. Topping the list in January was metal molding and trim, with prices up 48.3% from last year. One product that has seen rapid price growth acceleration over the past few months has been nonferrous metal and cable with prices up 19.7%. Price declines for materials over the year are concentrated among wood products with prices for particleboard and fiberboard down 24.4%, treated wood products down 5.0%, and softwood lumber down 3.3%.

Input Services

Prices for service inputs to residential construction reported an increase of 0.3% in January. On a year-over-year basis, service input prices were up 4.7%. The price index for service inputs to residential construction can be broken out into three separate components: a trade services component, a transportation and warehousing services component, and a services excluding trade, transportation, and warehousing component (other services).

The most significant component is trade services (around 60%), followed by other services (around 29%), and finally transportation and warehousing services (around 11%). The largest component, trade services, was up 7.1% from a year ago. The transportation and warehousing services rose 2.0%, while prices for other services were up 1.1% over the year.

Expanded Inputs to New Construction

Within the PPI that BLS publishes, new experimental data was recently published regarding inputs to new construction. The data expands existing inputs to industry indexes by incorporating import prices with prices for domestically produced goods and services. With this additional data, users can track how industry input costs are changing among domestically produced products and imported products. This data focuses on new construction, but the complete dataset includes indices across numerous industries that can be found here on BLS website. 

New construction input prices are primarily influenced by domestically produced goods and services, with domestic products accounting for 90% of the weight of the industry index for new construction. Imported goods make up the remaining 10% of the index.  

The latest available data, for November 2025, showed that domestically produced goods continue to have faster price growth compared to imported goods used in new construction. On a year-over-year basis, the index for domestic goods increased 3.0%, while prices for imported goods have fallen 3.0%.


This article was originally published by a eyeonhousing.org . Read the Original article here. .


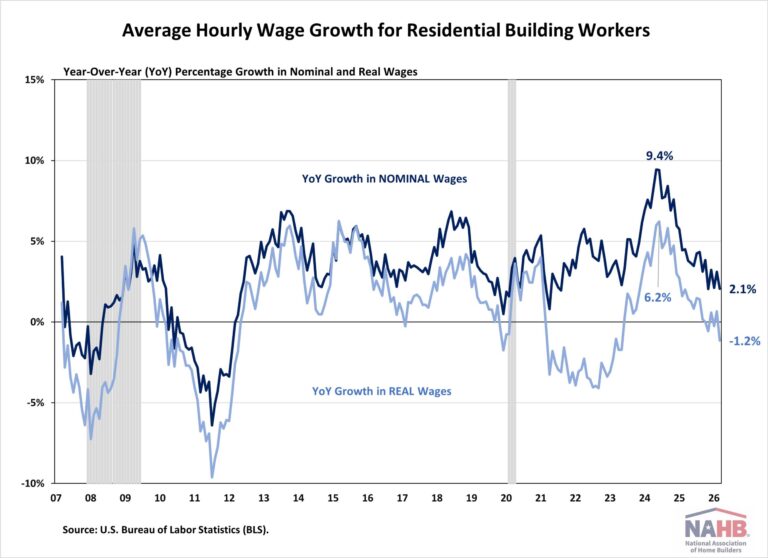
Wage growth for residential building workers moderated notably in 2025, reflecting a broader cooling in housing activity and construction labor demand. According to the latest data from the U.S. Bureau of Labor Statistics (BLS), both nominal and real wages remained modest during the fourth quarter, signaling a shift from the rapid post-pandemic expansion to a slower-growth phase.

In nominal terms, average hourly earnings (AHE) for residential building workers rose to $39.63 in December 2025, up 3.3% from $38.37 a year ago. While this marked a modest acceleration from November’s 2.0% year-over-year gain, wage growth has slowed considerably from the peak of 9.4% recorded in June 2024. Elevated mortgage rates, ongoing affordability challenges, and persistently high construction costs constrained home building activity over the past year. As a result, labor demand eased accordingly. Meanwhile, the number of open, and unfilled construction sector jobs continued to trend downward, consistent with the overall slowdown in housing activity.

Despite the slowdown in wage growth, residential building workers’ wages remain competitive relative to other industries:

9.9% higher than the manufacturing sector ($36.07 per hour)

23.3% higher than the transportation and warehousing sector ($32.14 per hour)

2.6% lower than the mining and logging sector ($40.69 per hour)

Note:

Data used in this post relate to all employees in the residential building industry. This group includes both new single-family housing construction (excluding for-sale builders) and residential remodelers but does not include specialty trade contractors.


This article was originally published by a eyeonhousing.org . Read the Original article here. .


Residential building material prices continued to experience elevated growth, according to the latest Producer Price Index release from the Bureau of Labor Statistics. Price growth has been above 3.0% since June this year, despite continued weakness in the new residential construction market. Across building materials, metal products continue to experience price increases, while ready-mix concrete and softwood lumber have experienced price declines over the past year.

The Producer Price Index for final demand increased 0.2% in November, after rising 0.1% in October. The index for final demand goods increased 0.9% in November. Over 80% of the November increase is due to prices for final demand energy, which was up 4.6% in November. This index for final demand for services was unchanged in November.

The price index for inputs to new residential construction rose 0.1% in November and was up 4.2% from last year. The price of goods used in new residential construction was up 0.4% over the month and 3.4% from last year. Meanwhile, the price for services was down 0.4% over the month and up 5.5% from last year.

Input Goods

The goods component has a larger importance to the inputs to residential construction price index, representing around 60%. On a monthly basis, the price of input goods to new residential construction was up 0.4% in November.

The input goods to residential construction index can be further broken down into two separate components, one measuring energy inputs with the other measuring remaining goods. The latter of these two components simply represents building materials used in residential construction, which makes up around 93% of the goods index.

Energy input prices rose 3.8% in November and were 2.0% higher than one year ago. Building material prices were up 0.2% in September and up 3.5% compared to one year ago. The 3.5% year-over-year increase is the largest increase since the 4.9% experienced back in January of 2023.

The largest year-over-year price increases continue to show in metal products. Topping the list in November was metal molding and trim, with prices up 48.2% from last year. Two key inputs, ready-mix concrete and softwood lumber, experienced price decreases from last year. Ready-mix concrete prices are down 0.7% compared to a year ago, likely a result of the recent stagnation in construction spending. Softwood lumber prices were down 8.0% in November from last year as prices continue to remain low.

Input Services

Prices for service inputs to residential construction reported a decline of 0.4% in November. On a year-over-year basis, service input prices were up 5.6%. The price index for service inputs to residential construction can be broken out into three separate components: a trade services component, a transportation and warehousing services component, and a services excluding trade, transportation and warehousing component (other services).

The most significant component is trade services (around 60%), followed by other services (around 29%), and finally transportation and warehousing services (around 11%). The largest component, trade services, was up 7.7% from a year ago. The transportation and warehousing services rose 4.2% while prices for other services were up 1.5% over the year.

Expanded Inputs to New Construction Data

Within the PPI that BLS publishes, new experimental data was recently published regarding inputs to new construction. The data expands existing inputs to industry indexes by incorporating import prices with prices for domestically produced goods and services. With this additional data, users can track how industry input costs are changing among domestically produced products and imported products. This data focuses on new construction, but the complete dataset includes indices across numerous industries that can be found here on BLS website. 

New construction input prices are primarily influenced by domestically produced goods and services, with domestic products accounting for 90% of the weight of the industry index for new construction. Imported goods make up the remaining 10% of the index.  

The latest available data, for August 2025, showed that domestically produced goods continue to have faster price growth compared to imported goods used in new construction. On a year-over-year basis, the index for domestic goods increased 2.5%, while prices for imported goods fell 0.7% over the same period.


This article was originally published by a eyeonhousing.org . Read the Original article here. .


Aggregate residential building material prices rose at their fastest pace since January 2023 in the latest Producer Price Index release from the Bureau of Labor Statistics. Input energy prices increased for the first time in over a year, while service price growth remained lower than goods.

The Producer Price Index for final demand increased 0.3% in September, after falling 0.1% in August. The index for final demand goods increased 0.9% in September, the largest monthly increase since February 2024. Final demand energy prices were responsible for most of the goods index increase, as they rose 3.5% in September. This index for final demand for services was unchanged in September.

The price index for inputs to new residential construction rose 0.2% in September and was up 3.1% from last year. The price of goods inputs was up 0.1% over the month and 3.5% from last year, while prices for services were up 0.3% over the month and 2.5% from last year.

Input Goods

The goods component has a larger importance to the inputs to residential construction price index, representing around 60%. On a monthly basis, the price of input goods to new residential construction was up 0.1% in September.

The input goods to residential construction index can be further broken down into two separate components, one measuring energy inputs with the other measuring remaining goods. The latter of these two components simply represents building materials used in residential construction, which makes up around 93% of the goods index.

Energy input prices rose 1.0% in September and were 3.0% higher than one year ago. Building material prices were up 0.1% in September and up 3.5% compared to one year ago. The 3.5% year-over-year increase is the largest increase since the 4.9% experienced back in January 2023. Residential building material price inflation slowly accelerated over the year, after starting around 2.0%.

The largest year-over-year price changes continue to be parts for construction machinery and equipment, sold separately, up 41.3% compared to September of last year. Metal molding and trim prices are up 31.0% from last year. Ready-mix concrete, a key input to new residential construction, has shown little price growth in 2025, up only 0.4% from last year. Additionally, softwood lumber prices were down 2.3% in September from last year. Lumber prices have experienced declines over the past few months despite higher tariffs now in place. Ongoing weaknesses during 2025 in new residential construction have led to an acute oversupply of lumber on the market, with demand below expectations.

Input Services

Prices for service inputs to residential construction reported an increase of 0.3% in September. On a year-over-year basis, service input prices were up 2.5%. The price index for service inputs to residential construction can be broken out into three separate components: a trade services component, a transportation and warehousing services component, and a services excluding trade, transportation and warehousing component (other services).

 The most significant component is trade services (around 60%), followed by other services (around 29%), and finally transportation and warehousing services (around 11%). The largest component, trade services, was up 3.1% from a year ago. The other services component was up 1.3% over the year.  Lastly, prices for transportation and warehousing services rose 2.6% compared to August of last year.


This article was originally published by a eyeonhousing.org . Read the Original article here. .


NAHB’s analysis of Census Data from the Quarterly Starts and Completions by Purpose and Design survey indicates year-over year growth for custom home builders amid broader single-family home building weakness. The custom building market is less sensitive to the interest rate cycle than other forms of home building but is more sensitive to changes in household wealth and stock prices. With spec home building down and the stock market up, custom building is gaining market share.

There were 54,000 total custom building starts during the second quarter of 2025. This was up 4% relative to the second quarter of 2024. Over the last four quarters, custom housing starts totaled 184,000 homes, just more than a 2% increase compared to the prior four quarter total (180,000).

Currently, the market share of custom home building, based on a one-year moving average, is approximately 19% of total single-family starts. This is down from a prior cycle peak of 31.5% set during the second quarter of 2009 and the 21% recent peak rate at the beginning of 2023, after which spec home building gained market share. The current market share is the highest since 2022.

Note that this definition of custom home building does not include homes intended for sale, so the analysis in this post uses a narrow definition of the sector. It represents home construction undertaken on a contract basis for which the builder does not hold tax basis in the structure during construction.

Discover more from Eye On Housing

Subscribe to get the latest posts sent to your email.


This article was originally published by a eyeonhousing.org . Read the Original article here. .


Both real and nominal wage growth for residential building workers slowed during the second quarter of 2025, reflecting a broader cooling in the construction labor market, according to the latest report from the U.S. Bureau of Labor Statistics (BLS).

In nominal terms, average hourly earnings (AHE) for residential building workers rose to $39.35 in June 2025, a 3.5% increase from $38.02 a year ago. This marks a continued deceleration in the year-over-year wage growth, which peaked at 9.3% in June 2024. The recent slowdown reflects a slowdown in residential construction activity and a decline in labor demand across the sector. Meanwhile, the number of open, and unfilled construction sector jobs has continued to trend downward, in line with the overall slowdown in housing activity.

Despite the slowdown in wage growth, residential building workers’ wages remain competitive:

11.4% higher than the manufacturing sector ($35.32/hour)

25.3% higher than the transportation and warehousing sector ($31.4/hour)

2.3% lower than the mining and logging sector ($40.29/hour)

Note:

Data used in this post relate to all employees in the residential building industry. This group includes both new single-family housing construction (excluding for-sale builders) and residential remodelers but does not include specialty trade contractors.

Discover more from Eye On Housing

Subscribe to get the latest posts sent to your email.


This article was originally published by a eyeonhousing.org . Read the Original article here. .
Pin It