Tag

Builder

Browsing


The National Association of Home Builders (NAHB) conducts an annual census to better understand the composition and characteristics of its members.  In 2025, 35% of NAHB’s membership was comprised of builder members—single-family and multifamily builders, residential and commercial remodelers, commercial builders, land developers, and manufacturers of modular/panelized/log homes.  The remaining 65% were associate members—those involved in support industries and professions, such as trade contractors, manufacturers, retailers/distributors, designers, and architects.

Among builder members, 62% are single-family home builders, 21% are residential remodelers, 5% each are commercial builders, land developers, and multifamily builders, and 1% each are commercial remodelers and manufacturers of modular/panelized/log homes.

Number of Housing Starts in 2025

The typical NAHB builder member is not a large company, but rather a small business. Builder members started a median of five housing units in 2025. That figure has fluctuated narrowly between five and six units since 2013. A plurality of 21% started two or three homes, 10% started one, 15% started four or five, 13% started six to ten, 13% started 11 to 25, 11% started 26 to 99, 8% started 100 to 499, and 3% started 500 homes or more.  About 7% did not start any homes at all in 2025.

Median Revenue of Builder Members in 2025

Most builders earned less than $5 million in total revenue in 2025: 14% reported a dollar volume of less than $500,000, 11% reported between $500,000 and $999,999, 38% (the plurality) between $1.0 and $4.9 million, 14% between $5.0 and $9.9 million, 7% between $10.0 million and $14.9 million, 10% between $15.0 million and $45.0 million, and 7% reported their dollar volume at more than $45.0 million. The median revenue remained unchanged from the previous year, at $3.7 million.  For comparison, the Small Business Administration’s size standards classify residential builders and remodelers as small if they have average annual receipts of $45.0 million or less ($34.0 million or less for land developers).

Median Number of Employees in 2025

The typical builder member had six employees on payroll in 2025, unchanged since 2023.  Due to their status as small businesses and extensive use of subcontractors, many builders carry relatively few employees on their payrolls. 

For more detail on the 2025 NAHB Builder Member Census, including a profile for each of the seven major categories of builders, please see the September 2026 Special Study.


This article was originally published by a eyeonhousing.org . Read the Original article here. .
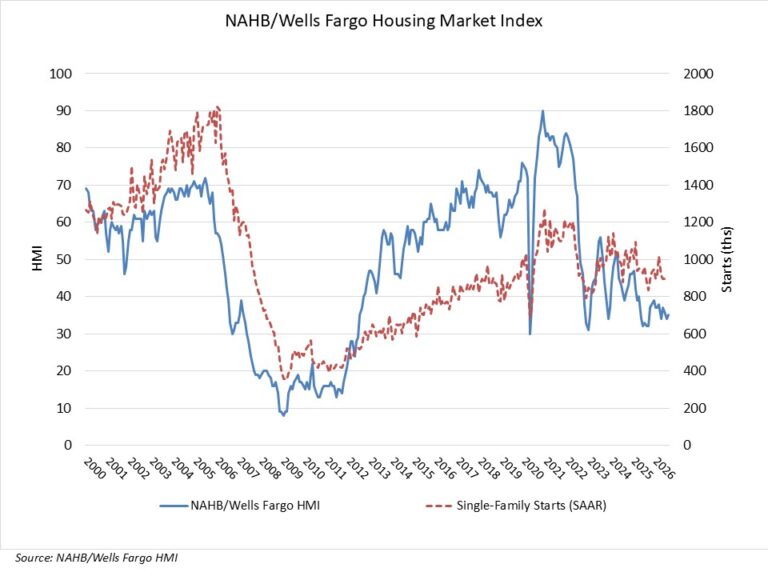

Builder sentiment remains muted from economic and geopolitical uncertainty, elevated mortgage rates and rising construction costs.

Builder confidence in the market for newly built single-family homes inched up one point to 35 in August, according to the National Association of Home Builders (NAHB)/Wells Fargo Housing Market Index (HMI).

August marked the 16th straight month that at least 30% of builders reported cutting prices to support demand, as well as the 16th consecutive month with the HMI below 40. Custom home builders continue to report stronger market conditions than spec builders, reflecting better conditions at the higher end of the market. Smaller, less dense markets are also outperforming larger metropolitan areas, and smaller builders report relatively stronger conditions than larger builders.

Rising gas and diesel prices are pushing up material costs, and spec home building remains weak as many prospective buyers stay on the sidelines. However, the Midwest remains a bright spot for the home building industry, with new home sales up in that region more than 2% so far in 2026.

The latest HMI survey also revealed that 35% of builders cut prices in August, down from 37% in July, and unchanged from June (35%). The average price reduction was 6% in August, the same rate as the previous month. The use of sales incentives was 63% in August, unchanged from the previous month.

Derived from a monthly survey that NAHB has been conducting for more than 40 years, the NAHB/Wells Fargo HMI gauges builder perceptions of current single-family home sales and sales expectations for the next six months as “good,” “fair” or “poor.” The survey also asks builders to rate traffic of prospective buyers as “high to very high,” “average” or “low to very low.” Scores for each component are then used to calculate a seasonally adjusted index where any number over 50 indicates that more builders view conditions as good than poor.

The index measuring current sales conditions increased two points to 39, while the indexes for future sales expectations and prospective buyer traffic held steady at 43 and 23, respectively.

Looking at the three-month moving averages for regional HMI scores, the Northeast fell one point to 44, the Midwest held steady at 45, the South fell two points to 31 and the West was unchanged at 27.

The HMI tables can be found at nahb.org/hmi.


This article was originally published by a eyeonhousing.org . Read the Original article here. .
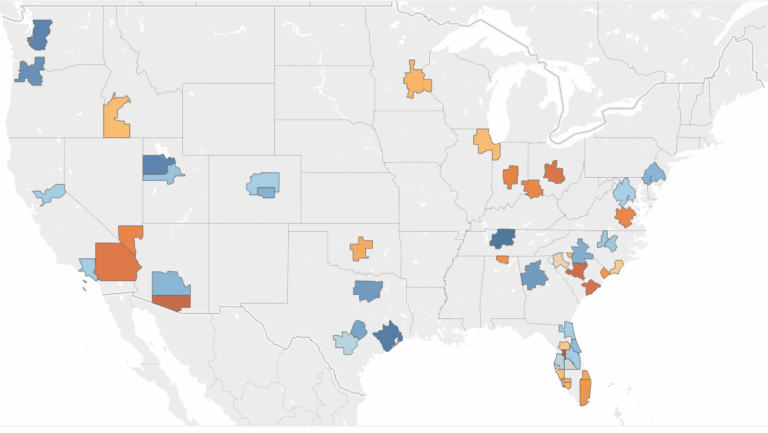

An earlier post described how the top ten builders  in the country accounted for 43.6% of new single-family closings in 2025. BUILDER magazine has now released additional data on the top ten builders within each of the 50 largest new home markets in the U.S., ranked by single-family permits. It is important to note that this post does not focus on the top ten largest home builders nationally; instead, it analyzes the top ten list within each of the largest 50 new housing markets.

The 2025 data show that the top 10 builder concentration in the 50 largest markets ranged from 53.4% in Nashville-Davidson-Murfreesboro-Franklin, TN to 99.5% in Tucson, AZ. In ten metro areas, the top ten builders’ market share exceeded 90%. Across all 50 metro areas, the average market share of the top 10 builders was 78.9%, down slightly from 79.3% in 2024.  

Looking at the results on a map reveals that South Carolina, southern Florida, and parts of the Midwest continue to include multiple highly concentrated markets, while Texas, the Northwest and the Mountain West markets have lower levels of concentration.

D.R. Horton made the top ten builder list in 47 markets, followed closely by Lennar at 45 markets. Both companies are present within the same top ten builder list in 42 metro areas. PulteGroup was next with 36 metro markets, followed by Meritage Homes and NVR with 22 and 20 metro markets, respectively.

From 2024 to 2025, 20 metro areas saw an increase in their top 10 builders’ market share, lower than the 27 increases from 2023 to 2024. The largest increases were seen in:

Tucson, AZ (+17.1 percentage points, 99.5%)

Miami-Fort Lauderdale-West Palm Beach, FL (+16.9 percentage points, 89.3%)

Richmond, VA (+8.7 percentage points, 91.3%)

Wilmington, NC (+8.4 percentage points, 80.8%)

On the other hand, 26 metro areas saw a decline in their top 10 builders’ market share from 2024 to 2025, up from 20 decreases from 2023 to 2024. Six metro areas experienced a double-digit decrease in 2025:

Philadelphia-Camden-Wilmington, PA-NJ-DE-MD (-18.2 percentage points, 69.3%)

Atlanta-Sandy Springs-Roswell, GA (-13.4 percentage points, 63.4%)

Jacksonville, FL (-12.1 percentage points, 74.4%)

Cape-Coral-Fort Myers, FL (-12.0 percentage points, 84.2%)

Salt Lake City-Murray, UT (-11.6 percentage points, 58.2%)

Spartanburg, SC (-10.4 percentage points, 83.1%)

The remaining four largest markets are new to the top 50 market list in 2025: Wildwood-The Villages, FL; Huntsville, AL; Punta Gorda, FL; and Colorado Springs, CO


This article was originally published by a eyeonhousing.org . Read the Original article here. .


Economic uncertainty and persistent affordability challenges driven by rising material prices, high land costs, and elevated mortgage rates continue to weigh on builder sentiment.

Builder confidence in the market for newly built single-family homes fell two points to 34 in July, down from an upwardly revised reading of 36 in June, according to the National Association of Home Builders (NAHB)/Wells Fargo Housing Market Index (HMI). Sentiment has remained below 40 for 15 consecutive months, the longest such stretch since 2012.

With the HMI below 40 for 15 straight months, affordability remains the home building industry’s primary challenge, as elevated mortgage rates, costly land, rising material prices, and persistent skilled labor shortages continue to affect the market. Looking ahead, the newly enacted 21st Century ROAD to Housing Act is a positive step that will help expand housing supply and lower overall housing costs, although more policy change is needed at the state and local level.

The latest HMI survey also revealed that 37% of builders cut prices in July, up from 35% in June and 32% in May. The average price reduction was 6% in July, the same rate as the previous month. The use of sales incentives was 63% in July, up slightly from 62% in June, and marking the 16th consecutive month this share has reached 60% or higher.

Derived from a monthly survey that NAHB has been conducting for more than 40 years, the NAHB/Wells Fargo HMI gauges builder perceptions of current single-family home sales and sales expectations for the next six months as “good,” “fair” or “poor.” The survey also asks builders to rate traffic of prospective buyers as “high to very high,” “average” or “low to very low.” Scores for each component are then used to calculate a seasonally adjusted index where any number over 50 indicates that more builders view conditions as good than poor.

All of the HMI sub-indices posted declines in July. The HMI index gauging current sales conditions fell one point to 37, the index measuring future sales dropped two points to 43 and the index charting traffic of prospective buyers posted a two-point decline to 23.

Looking at the three-month moving averages for regional HMI scores, the Northeast rose one point to 45, the Midwest increased two points to 45, the South fell one point to 33 and the West dropped one point to 26. The HMI tables can be found at nahb.org/hmi.


This article was originally published by a eyeonhousing.org . Read the Original article here. .

The top ten builders accounted for 43.6% of all new U.S. single-family home closings in 2025, down 1.2 percentage points from 2024 (44.8%), based on BUILDER magazine data.

The 2025 share constitutes 295,959 closings out of 679,083 new single-family houses sold in 2025. However, closings by the top ten builders only represent 29.5% of new single-family home completions,  a wider measure of home building that covers not-for-sale home construction. That share is down 0.6 percentage points from 2024 (30.1%), Also of note, the top 15 builders accounted for more than half of all closings (50.1%) for the second consecutive year.

Historically, the market share  for closings among the top ten builders has trended upward, albeit unevenly. Starting in 1989, this share was 8.7% and took approximately a decade  to double to 18.7% in 2000. It achieved a pre-Great Recession peak of 28.2% in 2006   then dropped below that level for about a decade until it reached 31.5% in 2018. After declining in 2019 and 2020, the share rebounded and exceeded 40% for the first time in 2022 (43.5%). A record high was achieved in 2024 (44.8%) before slipping to 43.6% in 2025.

Similar to closings, the trend for completions among the top ten builders has been rising, but with reduced volatility. The share started at 5.6% in 1989 and reached double digits ten years later at 11.3%. It achieved a pre-Great Recession peak of 17.9% in 2006 before falling for two consecutive years. Since 2009, the share has remained on an upward trajectory, breaking the 20% threshold for the first time in 2015 (21.0%). A record high was achieved in 2024 (30.1%), before slipping to 29.5% in 2025.

The top five highest producing builders did not change from 2024 to 2025, with D.R. Horton maintaining its position as America’s largest single-family home builder. D.R. Horton captured 12.8% of the for-sale market with 87,168 closings, marking a fifth consecutive year with a market share above 10%, and the 24th consecutive year atop the list. Nevertheless, this was D.R. Horton lowest share since 2021 (10.7%). Meanwhile, Lennar (the second largest builder) saw its market share in 2025 increase to a series-high of 12.2%. That was only 0.6 percentage points behind D.R. Horton, the closest difference since 2018. Results also show that 2025 marked the fourth year in a row where the top five builders accounted for more than a third (34.8%) of overall closings, with PulteGroup, NVR, and Meritage Homes achieving 4.4%, 3.2%, and 2.2% respectively.

The list of the top ten builders (all publicly traded companies) did not change from 2024 to 2025.  Most of the top ten builders experienced little to no change from 2024 to 2025 in terms of their share of the for-sale market, with the exceptions of D.R. Horton (-0.8 pp) and Lennar (+0.5 pp).

Builder Magazine will release Local Leaders data on the top ten builders in the top 50 largest new-home markets in the U.S. where ranking is determined by the number of single-family permits, which NAHB will analyze in a later post.


This article was originally published by a eyeonhousing.org . Read the Original article here. .

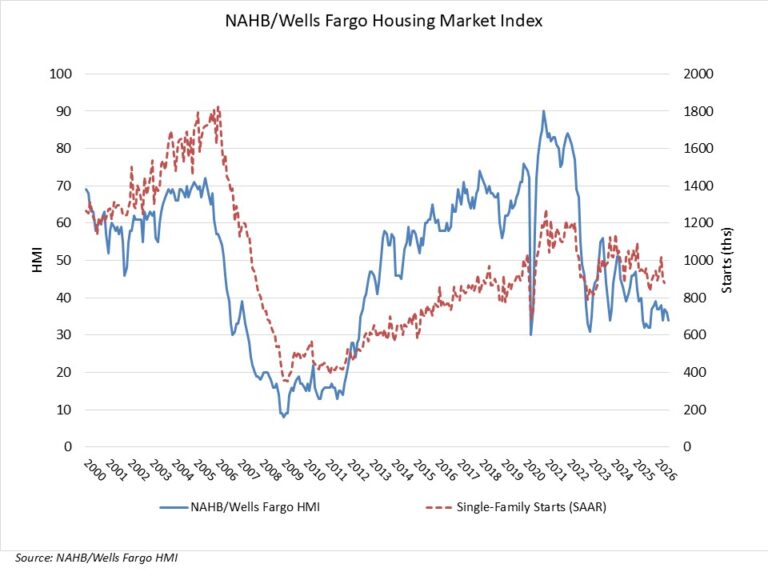
Builder sentiment remains subdued as rising material costs, elevated mortgage rates and ongoing affordability challenges continue to strain the housing market.

Builder confidence in the market for newly built single-family homes fell two points to 35 in June, according to the National Association of Home Builders (NAHB)/Wells Fargo Housing Market Index (HMI). This is the 14th straight month that sentiment has remained below 40, a streak not seen since 2011-2012 during the foreclosure crisis.

Costly and inefficient regulatory policy is clearly impeding the ability of builders to increase the housing supply. According to a new NAHB study, government regulation, taxes, fees and other costs add more than 26% to the price of an average single-family home. Easing permitting bottlenecks, density limits and inefficient zoning rules would help reduce costs and support the housing growth the nation needs.

The latest HMI survey also revealed that 35% of builders cut prices in June, up from 32% in May. The average price reduction was 6% in June, the same rate as the previous month. The use of sales incentives was 62% in June, up slightly from 61% in May, and marking the 15th consecutive month this share has reached 60% or higher.

Derived from a monthly survey that NAHB has been conducting for more than 40 years, the NAHB/Wells Fargo HMI gauges builder perceptions of current single-family home sales and sales expectations for the next six months as “good,” “fair” or “poor.” The survey also asks builders to rate traffic of prospective buyers as “high to very high,” “average” or “low to very low.” Scores for each component are then used to calculate a seasonally adjusted index where any number over 50 indicates that more builders view conditions as good than poor.

The HMI index gauging current sales conditions fell two points to 38 in June, the index measuring future sales held steady at 45 and the index charting traffic of prospective buyers remained unchanged at 25.

Looking at the three-month moving averages for regional HMI scores, the Northeast rose two points to 44, the Midwest held constant at 43, the South fell two points to 33 and the West dropped one point to 27. The HMI tables can be found at nahb.org/hmi.

Discover more from Eye On Housing

Subscribe to get the latest posts sent to your email.


This article was originally published by a eyeonhousing.org . Read the Original article here. .
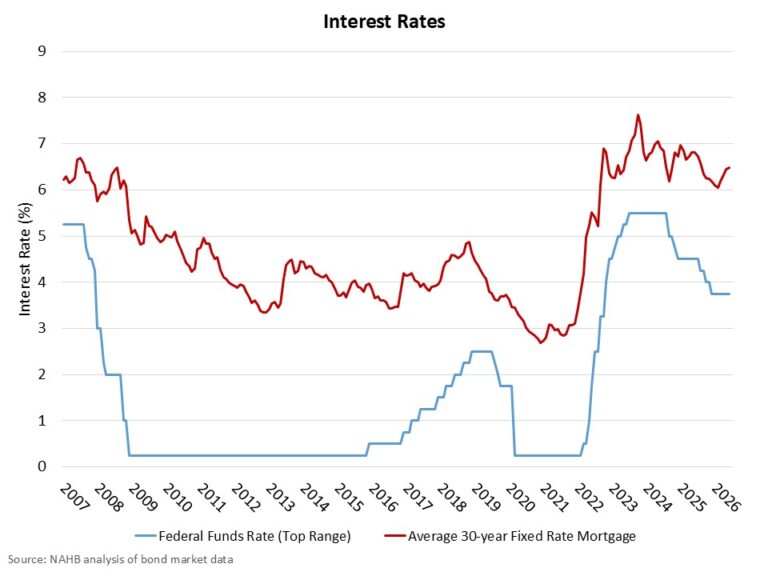

Builder confidence posted a modest gain in May even as buyers grapple with rising mortgage rates and economic uncertainty while builders continue to contend with elevated land, labor and construction costs.

Builder confidence in the market for newly built single-family homes increased three points to 37 in May, according to the National Association of Home Builders (NAHB)/Wells Fargo Housing Market Index (HMI).

Recent increases for long-term interest rates will continue to hold back home buyer demand. Although some regional markets, including parts of the Midwest, are showing relative strength, the housing market continues to face significant affordability challenges.

On the policy front, efforts in the House to modify the 21st Century ROAD to Housing Act could increase the nation’s housing supply and help ease builder concerns. In particular, the revision in the House bill with respect to the harmful built-to-rent proposal is a positive development.

The latest HMI survey also revealed that 32% of builders cut prices in May, down from 36% in April. The average price reduction was 6%, up from the 5% figure in April. The use of sales incentives was 61% in May, up slightly from 60% in April, and marking the 14th consecutive month this share has reached 60% or higher.

Derived from a monthly survey that NAHB has been conducting for more than 40 years, the NAHB/Wells Fargo HMI gauges builder perceptions of current single-family home sales and sales expectations for the next six months as “good,” “fair” or “poor.” The survey also asks builders to rate traffic of prospective buyers as “high to very high,” “average” or “low to very low.” Scores for each component are then used to calculate a seasonally adjusted index where any number over 50 indicates that more builders view conditions as good than poor.

All three of the major HMI indices posted gains in May, as some buyers who had been holding back decided to move forward this spring. The HMI index gauging current sales conditions rose three points to 40 from April to May, the index measuring future sales increased three points to 45 and the index charting traffic of prospective buyers posted a three-point gain to 25.

Looking at the three-month moving averages for regional HMI scores, the Midwest registered a one-point gain to 43, the Northeast rose one point to 42, the South held constant at 35 and the West fell one point to 28.

The HMI tables can be found at nahb.org/hmi.


This article was originally published by a eyeonhousing.org . Read the Original article here. .
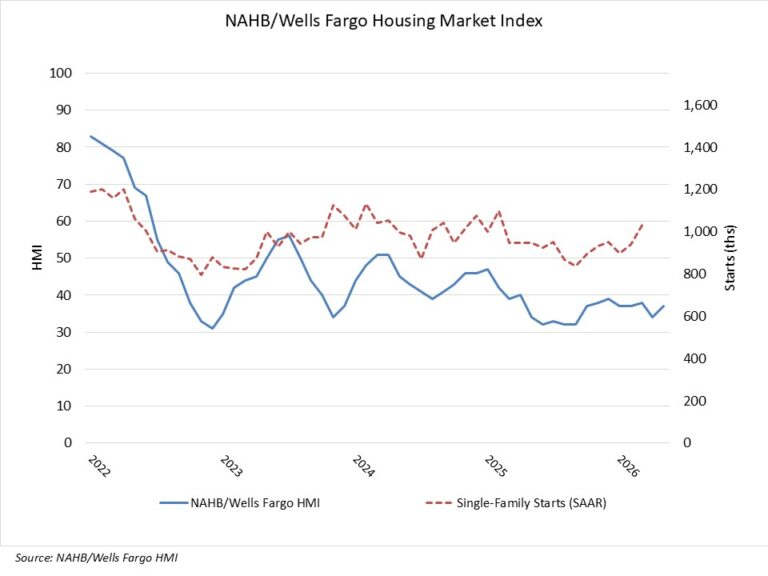

Economic uncertainty coupled with rising building material costs and interest rates resulted in a sharp decline in builder sentiment in April as the housing market enters into the heart of the spring buying season.

Builder confidence in the market for newly built single-family homes fell four points to 34 in April, according to the National Association of Home Builders (NAHB)/Wells Fargo Housing Market Index (HMI). This is the lowest level since September 2025.

Builder sentiment fell back in spring as buyers face ongoing elevated interest rates and growing economic uncertainty. The year started with hopes for housing momentum growth, but risks with respect to the Iran war, energy costs, and declines for consumer confidence have slowed the market.

With oil prices higher in the U.S., 62% of builders reported suppliers have increased building material costs due to higher fuel prices, including gas and diesel. Energy costs make up approximately 4% of residential construction material input and service costs.  With near-term economic risks elevated, 70% of builders reported challenges pricing homes given uncertainty about material costs.

The latest HMI survey also revealed that 36% of builders cut prices in April, down slightly from 37% in March. The average price reduction was 5%, down from the 6% figure in March. The use of sales incentives was 60% in April, down from 64% in March, and marking the 13th consecutive month this share reached 60% or higher.

Derived from a monthly survey that NAHB has been conducting for more than 40 years, the NAHB/Wells Fargo HMI gauges builder perceptions of current single-family home sales and sales expectations for the next six months as “good,” “fair” or “poor.” The survey also asks builders to rate traffic of prospective buyers as “high to very high,” “average” or “low to very low.” Scores for each component are then used to calculate a seasonally adjusted index where any number over 50 indicates that more builders view conditions as good than poor.

All three of the major HMI indices posted losses in April. The HMI index gauging current sales conditions fell four points to 37 from March to April, the index measuring future sales dropped seven points to 42 and the index charting traffic of prospective buyers posted a three-point decline to 22.

Looking at the three-month moving averages for regional HMI scores, the Northeast fell two points to 42, the Midwest dropped two points to 41, the South held constant at 35 and the West fell three points to 29.

The HMI tables can be found at nahb.org/hmi.


This article was originally published by a eyeonhousing.org . Read the Original article here. .


Builder sentiment inched up in March even as builders continue to express affordability concerns stemming from elevated construction costs and shortages of buildable lots and labor.

Builder confidence in the market for newly built single-family homes rose one point to 38 in March, following a revised upward one-point revision in February, according to the National Association of Home Builders (NAHB)/Wells Fargo Housing Market Index (HMI). All responses to the March survey were received after the conflict with Iran started.

Affordability for buyers and builders remains a top concern. Many buyers remain on the fence waiting for lower interest rates and due to economic uncertainty.

While the Freddie Mac 30-year fixed rate mortgage averaged 6.05% in February, the lowest since August 2022, downpayment hurdles and uncertainty from the conflict with Iran and the price of oil will be headwinds going forward. The administration’s executive orders issued last week to reduce regulatory burdens associated with home building are a positive step toward increasing attainable housing supply.

The latest HMI survey also revealed that 37% of builders cut prices in March, up slightly from 36% in February. The average price reduction remained stable at 6%. The use of sales incentives was 64% in March, down one percentage point from February, and marking the 12th consecutive month this share exceeded 60%.

Derived from a monthly survey that NAHB has been conducting for more than 40 years, the NAHB/Wells Fargo HMI gauges builder perceptions of current single-family home sales and sales expectations for the next six months as “good,” “fair” or “poor.” The survey also asks builders to rate traffic of prospective buyers as “high to very high,” “average” or “low to very low.” Scores for each component are then used to calculate a seasonally adjusted index where any number over 50 indicates that more builders view conditions as good than poor.

All three of the major HMI indices posted gains in March. The HMI index gauging current sales conditions increased one point to 42 from February to March, the index measuring future sales gained two points to 49 and the index charting traffic of prospective buyers posted a three-point increase to 25.

Looking at the three-month moving averages for regional HMI scores, the Northeast held steady at 44, the Midwest was unchanged at 43, the South held constant at 35 and the West fell two points to 31. The HMI tables can be found at nahb.org/hmi.


This article was originally published by a eyeonhousing.org . Read the Original article here. .
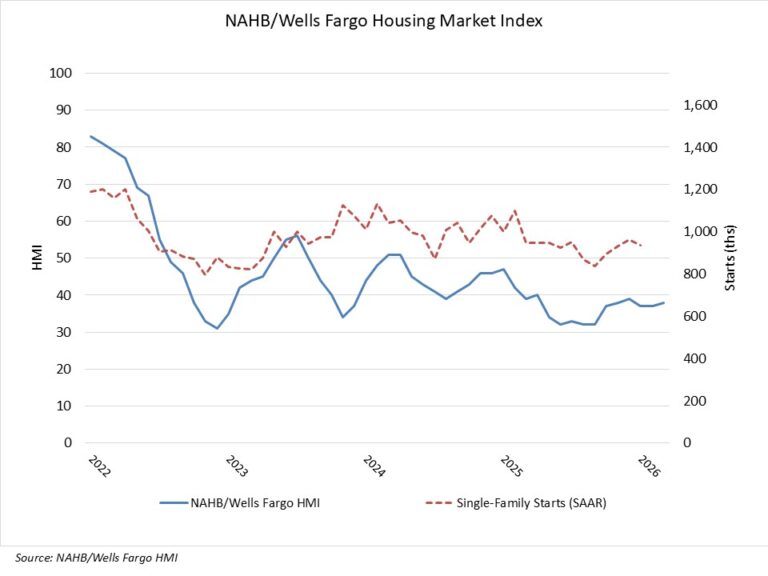

Builder confidence in the market for newly built single-family homes fell one point to 36 in February, according to the National Association of Home Builders (NAHB)/Wells Fargo Housing Market Index (HMI).

Persistent affordability challenges, including high housing price-to-income ratios and elevated land and construction costs, helped push builder confidence lower for the second straight month to start the year.

Housing affordability remains an ongoing challenge at the start of 2026. The solution for the housing market is the enactment of policies that will bend the construction cost curve and enable additional supply of attainable housing. On the positive side, easing inflation should continue to allow lower interest rates for mortgages and builder loans.

The latest HMI survey also revealed that 36% of builders cut prices in February, down from 40% in January. While this marks the lowest incidence of price-cutting since last May (34%), the average price reduction remains at 6%. The use of sales incentives was 65% in February, unchanged from January, and marking the 11th consecutive month this share has exceeded 60%.

While the majority of builders continue to deploy buyer incentives, including price cuts, many prospective buyers remain on the sidelines. Although demand for new construction has weakened, remodeling demand has remained solid given a lack of household mobility, per comments from builders in the HMI.

Derived from a monthly survey that NAHB has been conducting for more than 40 years, the NAHB/Wells Fargo HMI gauges builder perceptions of current single-family home sales and sales expectations for the next six months as “good,” “fair” or “poor.” The survey also asks builders to rate traffic of prospective buyers as “high to very high,” “average” or “low to very low.” Scores for each component are then used to calculate a seasonally adjusted index where any number over 50 indicates that more builders view conditions as good than poor.

The HMI index gauging current sales conditions held steady at 41 from January to February, the index measuring future sales fell three points to 46 and the gauge charting traffic of prospective buyers fell two points to 22.

Looking at the three-month moving averages for regional HMI scores, the Northeast fell one point to 43, the Midwest held steady at 43, the South dropped one point to 35 and the West fell two points to 33. HMI tables can be found at nahb.org/hmi.

Editor’s Note: With the official 2026 release schedule for the Survey of Construction still unavailable from the U.S. Census Bureau, NAHB confirms the HMI for March 2026 will be released on March 16.  A schedule for the rest of the year will be available as soon as possible.


This article was originally published by a eyeonhousing.org . Read the Original article here. .
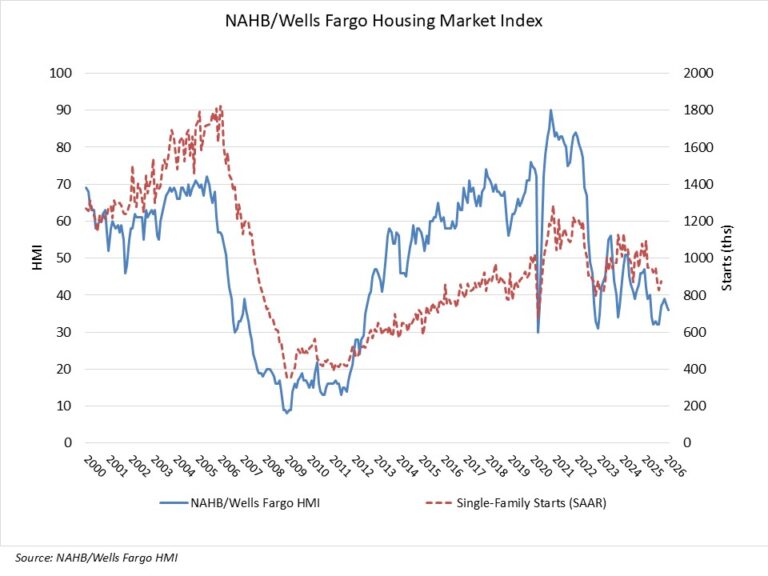
Pin It
