Tag

Areas

Browsing


In April 2020, total payroll employment in the United States fell by an unprecedented 20.5 million, following a loss of 1.4 million in March, as the COVID-19 pandemic brought the economy to a sudden halt. The unemployment rate surged by 10.4 percentage points to 14.8% in April. It was the highest rate effectively since the Great Depression. Tracking the labor market impact is critical for understanding the follow-on effect on home building activity during the last five years.

As people stayed at home and businesses shut down under government directives, millions of Americans lost their jobs. Initial unemployment insurance claims soared to 2.9 million during the week of March 21, 2020. For the following 19 consecutive weeks, more than one million Americans filed for unemployment each week, totaling roughly 50.9 million claims over just five months.

While the national labor market suffered an unprecedented collapse in both speed and depth, the effects varied significantly across U.S. metro areas. Local economies experience dramatically different outcomes depending on their industrial composition, the feasibility of remote work, and the strictness of local public health restrictions. A map of metro areas across the United States reveals striking variations in employment losses from February 2020 to the pandemic’s employment trough. Nonfarm employment payrolls declined by anywhere from 5% to 35% across 393 metro areas.

Kahului-Wailuku, Hawaii, experienced the steepest job losses, with employment plummeting by 35%. This metro area’s deep dependence on tourism and hospitality, particularly in accommodation and food services, left it vulnerable to travel restrictions and widespread shutdown. Similarly, Atlantic City-Hammonton, New Jersey, as a prime tourism destination, was devastated by pandemic-related closures. By May 2020, its total employment dropped 34% from the February 2020 level.

Some metro areas experienced major setbacks tied to their dominant industries. In Elkhart-Goshen, Indiana, as the heart of the U.S. RV manufacturing industry, employment plunged 34% as production ground to a halt.

At the other end of the spectrum, Logan, UT-ID, recorded the mildest downturn, with a relatively modest 5% employment drop, reflecting a more resilient local economy.

In sheer numbers, New York-Newark-Jersey City, New York-New Jersey saw the largest employment losses in the nation, shedding nearly 2 million jobs, or about 20% of its pre-pandemic workforce. Los Angeles–Long Beach–Anaheim, California, followed closely, losing 1.1 million jobs, about 17% of its February 2020 level.

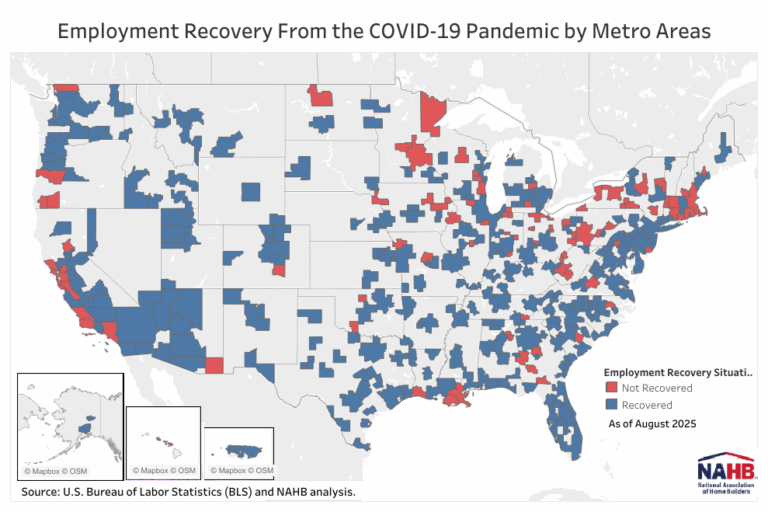
Despite the historic scale of these losses, the U.S. labor market rebounded faster than many anticipated. Within just 26 months, overall employment had fully recovered, surpassing its February 2020 level to reach 152.4 million by June 2022. Yet, as with the initial losses, the recovery varied widely across metro areas. By August 2025, 93 of the 393 metro areas had still not regained their pre-pandemic employment levels.

Lake Charles, Louisiana, remains the slowest to recover, with employment at only 87% of its February 2020 level. The region’s setbacks have been compounded by multiple disasters—COVID-19, followed by Hurricanes Laura and Delta in 2020—that disrupted both infrastructure and labor markets. Kankakee, Illinois (92% recovered), and Weirton–Steubenville, West Virginia–Ohio (93%), also lagged, highlighting how recovery can be delayed by structural and regional challenges.

In contrast, many other metro areas have not only recovered but expanded beyond their pre-pandemic employment levels. As of August 2025, 300 metro areas have fully rebounded, with some even booming. Wildwood–The Villages, Florida, leads the nation with employment reaching 127% of its February 2020 level, followed by St. George, Utah, at 125%.

Notably, the areas that suffered the sharpest employment declines in 2020 did not necessarily experience the slowest recoveries. Las Vegas–Henderson–North Las Vegas, Nevada, for instance, lost 277,900 jobs, about 26% of its workforce, but has rebounded strongly, reaching 109% of its pre-pandemic employment. By contrast, Enid, Oklahoma, which lost just 1,600 jobs, remains slightly below its February 2020 level, still 2% short of full recovery.

The story of employment loss and recovery across U.S. metro areas underscores the uneven geography of the COVID-19 economy. The resilience of local economies has since reshaped the post-pandemic landscape, revealing not only where recovery has taken root but also where it remains incomplete. And of course, the health of local labor markets has important impacts on the status of local home building and remodeling conditions.


This article was originally published by a eyeonhousing.org . Read the Original article here. .

Real GDP of metropolitan areas rose 2.7% in 2023, with the “real estate, rental and leasing” sector contributing 0.34 percentage points and construction contracting growth by 0.11 percentage points. While many metro areas followed the national growth trend, each region has its unique economic narrative. This article explores the economic trends driving these outcomes, focusing on the leading metro areas in real GDP growth, the construction sector’s standout performers over a five-year period, and the top MSAs benefiting from growth in real estate, rental, and leasing.

In 2023, real GDP increased in 348 Metropolitan Statistical Areas (MSAs), decreased in 34 MSAs, and remained unchanged in 3 MSAs, according to the U.S. Bureau of Economic Analysis (BEA). The data, which was recently released in December 2024, shows the range of growth spanned from 42.9% in Midland, TX, to a contraction of -9.3% in Elkhart-Goshen, IN. Three MSAs—Ithaca, NY, Joplin, MO, and Longview, WA—saw no change in real GDP.

The oil and gas sector played a significant role in driving growth in many MSAs. Midland, TX, recorded the highest growth due to a surge in oil production, with the “mining, quarrying, and oil and gas extraction” industry contributing a hefty 41.2 percentage points to the metro area’s GDP growth. Furthermore, among the top five highest growth areas, four had this industry as the leading contributor.

Top Five MSAs by Real GDP Growth and Leading Contributing Industry

Metro Area2023 Real GDP Growth (%)Largest Contributing IndustryContribution (Percentage Points)Midland, TX42.9Mining, quarrying, and oil and gas extraction41.2Greeley, CO18.5Mining, quarrying, and oil and gas extraction15.5El Centro, CA16.4Agriculture, forestry, fishing, and hunting14.4Odessa, TX11.6Mining, quarrying, and oil and gas extraction7.1Wheeling, WV-OH10.7Mining, quarrying, and oil and gas extraction9.9

Construction Sector Growth (2018–2023)

From 2018 to 2023, the construction industry exhibited a mixed performance, with 140 MSAs reporting positive compound annual growth rates (CAGR), 188 recording declines, and 5 showing no change. States like Idaho, Arizona, and Florida emerged as hotspots for construction growth during this period while states in the East North Central division appear to have slowdowns in this sector.

Elizabethtown-Fort Knox, KY, led with a 14.4% CAGR in construction. This boom was primarily driven by the development of the BlueOval SK Battery Park, slated to begin production in 2025. This joint venture between Ford Motor Company and SK On, a South Korean electric vehicle (EV) supplier, is expected to be the largest EV battery manufacturing facility globally.

According to a study by the Hardin County Chamber of Commerce (HCCC), the project is estimated to:

Generate $1.6 billion in construction payroll.

Create 5,000 jobs by the end of 2025.

Require 3,100 additional housing units to accommodate new workers.

Top Five MSAs for Construction Growth (2018–2023):

Metro AreaCAGR (%)Average Contribution (Percentage Points)Elizabethtown-Fort Knox, KY14.40.45Clarksville, TN-KY10.80.03Punta Gorda, FL10.61.12Jacksonville, NC10.20.32The Villages, FL10.11.23

Real Estate, Rental, and Leasing Growth (2018–2023)

The real estate, rental, and leasing sector also showed robust growth in many regions, with 209 MSAs experiencing positive growth during the five-year period. The Villages, FL, recorded the highest CAGR at 14.1%, reflecting its status as the nation’s largest community designed for an aging population.

Other MSAs like Jonesboro, AR, saw significant real estate growth due to proximity to Arkansas State University, while Austin-Round Rock-Georgetown, TX, benefited from a population influx because of its thriving tech economy.

Top Five MSAs for Real Estate Growth (2018–2023):

Metro AreaCAGR (%)Average Contribution (Percentage Points)The Villages, FL14.13.6Jonesboro, AR12.11.2Twin Falls, ID10.81.1Austin-Round Rock-Georgetown, TX10.71.4El Centro, CA10.60.6

Visit NAHB’s dashboard for additional data and visualizations on demographics, housing market and the economy for all metro areas.

Discover more from Eye On Housing

Subscribe to get the latest posts sent to your email.


This article was originally published by a eyeonhousing.org . Read the Original article here. .


NAHB’s featured topic for the second quarter HBGI reveals that 17.5% of single-family and 8.6% of multifamily construction takes place in second home areas. Recent NAHB analysis found that the total count of second homes across the US was 6.5 million, which accounts for 4.6% of the total housing stock. For this analysis, a second home area is a county that has a second home share greater than 10.3% of the county’s total housing stock (these counties fall within the 75th and above percentile of the second home stock share distribution).  There are 788 counties that are considered a second home area based on this definition.

Single-family

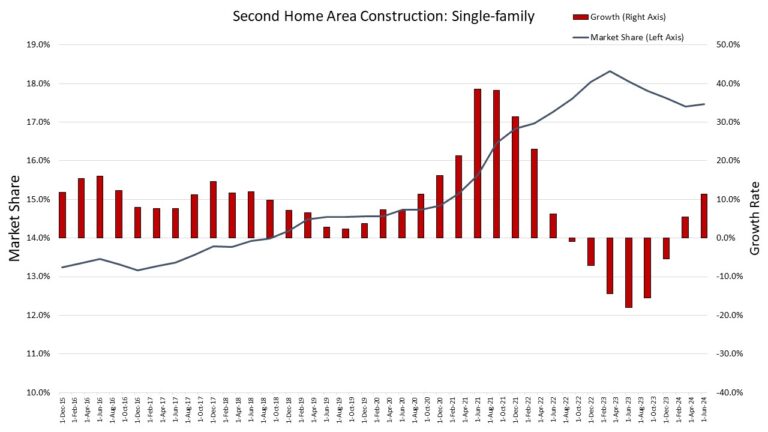
Single-family permit data shows that the market share for construction in second home areas has grown by over four percentage points in the past nine years. The earliest data, which is the fourth quarter of 2015, shows that second home areas had a market share of 13.2%. As of the second quarter of 2024, the market share for this geography increased to 17.5%. However, this latest reading is down from a peak of 18.3% in the first quarter of 2023.  

The peak growth rate in construction for second homes areas was at 38.5% in the third quarter of 2021. The first recorded decline in the growth rate occurred in the third quarter of 2022. This downward growth rate was followed by five quarters of declines until the first quarter of 2024.   Second home areas have averaged a growth rate of 9.1% between the fourth quarter of 2015 and the second quarter of 2024, while non-second home areas averaged single-family a growth rate of 5.1% over the same period.  

Multifamily

Although smaller, the market share for second home areas has also grown for multifamily construction. The market share was 5.5% in the fourth quarter of 2015 and is now 8.6%, a 3.1 percentage point increase. This increase in market share has been more volatile than single-family, as growth in construction has not been as consistent for multifamily in second home areas. 

There have been three periods where construction growth for multifamily experienced declines in these areas, such as in 2017 and early 2021. The third period of decline is ongoing, as there have been two consecutive quarters where the growth rate has been negative to start 2024. The latest growth rate is a11.8% decline. This is down from a peak of 53.1% in the third quarter of 2022, as multifamily construction has slowed nationwide. 

Discover more from Eye On Housing

Subscribe to get the latest posts sent to your email.


This article was originally published by a eyeonhousing.org . Read the Original article here. .
Pin It