Tag

Area

Browsing


An outdoor dining area can function as an extension of the home, providing additional space for hosting family and friends. The popularity of al fresco entertaining has soared recently as more people take advantage of outdoor living areas. You can make your outdoor dining experience even better with these upgrades, which range from simple updates to larger projects. Here are 10 ways to add color, style and function to your outdoor dining area.

Digs Design CompanySave Photo
1. Dress Up Your Table

No budget to buy new dining furniture this year? Pick up some fresh table linens, seat cushions, place mats, napkins and colorful outdoor dishes to add pizazz without the price tag. New accessories go a long way toward elevating the festive factor.

10 Outdoor Living Essentials to Get Ready for Summer

KD Designs Custom InteriorsSave Photo
2. Roll Out a Rug

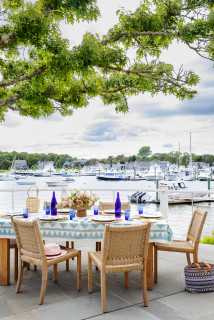
Protect your patio or deck while adding pattern, texture and a punch of color to your outdoor dining area with a large outdoor rug. Choose one that’s weather- and stain-resistant so it lasts more than one season.

Pro tip: Keep the rug’s edges from curling up by placing furniture legs in strategic spots or roll up some masking tape into balls and place it under the corners.

Edible Earth ResourcesSave Photo
3. Plant a Vertical Herb Garden

Limited space to plant culinary herbs for your grilling area? Look up! Outdoor kitchens can benefit from a living wall made from a specialized vertical garden system or horizontally hung gutters. Not only will a vertical garden add color and texture, but you can snip fresh herbs to season your dishes whenever you need them. Also consider vertically hanging some strawberry or cherry tomato plants to pluck produce straight from the vine.

Find home design and remodeling professionals on Houzz

Flavin ArchitectsSave Photo
4. Incorporate Music With Outdoor Speakers

Get the outdoor party started by spinning your favorite playlist (keeping neighbors in mind when it comes to volume, of course). There are many wireless speakers on the market that can withstand the elements. Some are even designed to look like elements of a landscape, such as boulders. Others can be hung in the corners of your patio or set up on side tables.

Cathie Hong InteriorsSave Photo
Clear ConstructionSave Photo
6. Brighten Things Up With Outdoor Lighting

You’ll need both task and ambient lighting to accommodate evening cooking and entertaining. Clip lights to your barbecue’s lid, hang up rows of string lights for some sparkle and set up freestanding lanterns or hurricane lamps with wax or artificial candles to keep the glow going while you’re outside.

Del Gavio GroupSave Photo
7. Extend Patio Season by Adding Heaters

Who says you can’t enjoy your deck area in early spring or late fall? By installing natural gas or portable propane patio heaters — which can be safely used under eaves and pergolas — you can spend more time outdoors with loved ones. If you have an overhang on your house, you can also put outdoor-rated infrared heaters in the ceiling above your dining or lounge areas.

BellCraft ArchitectsSave Photo
8. Add a Fire Feature

A fireplace, fire table or several fire columns can transform a ho-hum patio into a spot where everyone wants to gather. Having a fire feature not only adds an outdoor focal point, it also helps you stay warm on chilly evenings as summer wanes. Choose from hundreds of models on the market, including some that double as dining tables — they come with a removable top that hides the gas fire feature underneath.

10 Things to Know About Buying a Fire Pit for Your Yard

9. Put Up a Privacy Screen

If you live in an urban or suburban neighborhood, you might be able to see your neighbors over the fence and vice versa. If you need more privacy in your outdoor kitchen or dining area, install a decorative screen that’s both functional and beautiful. Choose ones made from wood, wrought iron with cutout designs, bamboo or lattice for added visual appeal.

Why You Should Consider a Landscape Screen for Your Yard

Clear ConstructionSave Photo
10. Add a Pergola or Retractable Awning

Because you might want to enjoy being outside even if the sun is blazing or the rain is pouring down, consider adding a structure overhead to create shade, shelter and interest. There are many options to choose from, including pergolas, arbors, shade trees and retractable awnings that can protect you from the elements when needed. Bonus: If you add an open-air structure, you can plant flowering vines and enjoy their scent all season.

More on Houzz
Read more landscape stories
Browse outdoor photos for ideas
Find a landscape contractor


This article was originally published by a
www.houzz.com . Read the Original article here. .


U.S. house prices continued to rise in the first quarter of 2026, but appreciation slowed markedly from the rapid pace seen during the pandemic-era housing boom. Higher mortgage rates, persistent affordability challenges, and softer demand weighed on price growth nationally. At the same time, local market conditions varied considerably. Some states and metropolitan areas continued to post solid gains, while others experienced flat or declining house prices.

According to the quarterly purchase-only House Price Index1 (HPI) released by the Federal Housing Finance Agency (FHFA), national house prices rose 1.7% in the first quarter of 2026 from a year earlier. This growth rate represented the slowest annual appreciation since the second quarter of 2012, signaling the continued cooling of house price growth after more than a decade of strong gains. On a quarterly basis, house prices increased a modest 0.5% from the fourth quarter of 2025.

The FHFA’s purchase-only HPI tracks average price changes using more than six million repeat-sales transactions involving the same single-family properties. In addition to the national picture, the index provides valuable insight into house price trends across states and metropolitan areas.

At the state level, house price performance remained positive across most of the country in the first quarter of 2026, although appreciation rates varied widely. Annual appreciation ranged from a 2.4% decline to a 16.3% gain.

Puerto Rico recorded the strongest annual appreciation, with house prices surging 16.3% from a year earlier. Among the 50 states and the District of Columbia, Illinois posted the largest gain (7.3%), followed by Alaska (5.5%), Vermont (4.9%), and Connecticut (4.7%). More broadly, many states across the Midwest and Northeast continued to outperform the national average.

At the other end of the spectrum, Colorado recorded the largest annual decline, with house prices falling 2.4% from a year earlier. Texas and the District of Columbia also posted modest declines, while several Western and Sun Belt states saw only limited appreciation. Many of the markets that experienced some of the strongest price growth during 2021–2022 continue to face affordability pressures and softer buyer demand.

Overall, 42 states and Puerto Rico reported annual house price gains. In addition, 31 states and Puerto Rico matched or exceeded the national appreciation rate of 1.7%, underscoring the resilience of many regional housing markets despite challenging financing conditions.

House price performance varied even more widely across metropolitan areas than at the state level. Among the nation’s 100 largest metro areas tracked by FHFA, annual house price appreciation ranged from a decline of 6.9% to an increase of 10.8% in the first quarter of 2026.

The strongest-performing metro areas were concentrated primarily in the Midwest and Northeast, where limited housing supply continued to support price growth. Several metro areas in Pennsylvania, New York, Ohio, and Illinois posted especially strong annual gains, reflecting continued demand amid limited supply.

In contrast, some of the weakest-performing markets were located in Florida, Texas, and parts of the Mountain West. Austin-Round Rock-San Marcos, Texas, recorded the steepest annual price decline among the top 100 metro areas, continuing a correction after several years of exceptionally rapid house price growth. Cape Coral–Fort Myers, Florida, also remained among the nation’s weakest housing markets, extending a trend of price declines amid cooling demand and a gradual rebalancing of market conditions.

Overall, one-third of the 100 largest metro areas posted annual price declines in the first quarter of 2026, while the remaining two-thirds recorded either positive appreciation or essentially flat price growth.

Note:

Unless otherwise noted, this blog post uses the quarterly purchase-only House Price Index (HPI), which measures the sales prices of homes that are bought and sold, rather than the broader all-transactions HPI. The purchase-only HPI provides a more precise view of current market conditions.


This article was originally published by a eyeonhousing.org . Read the Original article here. .


The owners of this London home were pretty happy with the kitchen when they moved in but felt it didn’t really reflect their style. Unsure how to remedy that, they looked to Houzz, where they came across the profile of interior designer Jo Kaur Llogarajah of Studio JKL. “We instantly connected and they were drawn to what they described as my personable approach and understanding of the home being an intimately personal space, rather than promoting a ‘house style,’” Llogarajah says. “The family are from Senegal and wanted their heritage incorporated into the design.”

Llogarajah, using Houzz Pro, addressed the look of the space and tweaked the layout to create a more family-friendly environment. And thanks to some thoughtful and sustainably minded choices, it was all done on a tight budget. Check out the before-and-after photos below.


This article was originally published by a www.houzz.com . Read the Original article here. .


House price growth slowed in the first quarter of 2025, partly due to a decline in demand and an increase in supply. Persistent high mortgage rates and increased inventory combined to ease upward pressure on house prices. These factors signaled a cooling market, following rapid gains seen in previous years.

Nationally, according to the quarterly all-transactions House Price Index (HPI) released by the Federal Housing Finance Agency (FHFA), U.S. house prices rose 4.7% in the first quarter of 2025, compared to the first quarter of 2024. This year-over-year (YoY) rate was lower than the previous quarter’s rate of 5.5%. The FHFA’s all-transactions HPI tracks average price changes based on repeat sales and refinancings of the same single-family properties. It offers insights not only at the national level but also across states and metropolitan areas.

Between the first quarter of 2024 and the first quarter of 2025, all 50 states and the District of Columbia experienced positive house price appreciation, ranging from 1.0% to 8.4%. Connecticut and Rhode Island topped the house price appreciation list with an 8.4% gain each, followed by New Jersey with a 7.8% gain. On the opposite end, Louisiana recorded the lowest house price appreciation at 1.0%. Out of all 50 states and the District of Columbia, 26 states exceeded the national YoY growth rate of 4.7%. However, on a quarterly basis, home price appreciation slowed in 39 states compared to the fourth quarter of 2024, highlighting a broad-based deceleration in the housing market.

House price growth widely varied across U.S. metro areas year-over-year, ranging from -7.0% to +23.0%. Rome, GA recorded the largest decline in house prices, whereas Johnstown, PA posted the highest increase over the previous four quarters. In the first quarter of 2025, 28 metro areas, in reddish color on the map above, experienced negative house price appreciation. Meanwhile, 356 metro areas experienced price increases.

Since the onset of the COVID-19 pandemic, house prices have surged nationally. Between the first quarter of 2020 and the first quarter of 2025, house prices rose by 54.9% nationwide. More than half of metro areas outpaced this national price growth rate of 54.9%.

The table below highlights the top ten and bottom ten markets for house price appreciation during this five-year period. Among all the metro areas, house price appreciation ranged from 16.7% to 90.1%. Hinesville, GA led the nation with the highest house price appreciation. Lake Charles, LA recorded the lowest appreciation, marking its fourth consecutive quarter at the bottom.

Discover more from Eye On Housing

Subscribe to get the latest posts sent to your email.


This article was originally published by a eyeonhousing.org . Read the Original article here. .


Following two straight quarters of deceleration, house price appreciation accelerated slightly in the fourth quarter of 2024 due to the persistent high mortgage rates and low inventory. Although inventories of existing homes have improved from a year ago, the current 3.5-month supply remains below the 4.5- to 6-month supply that considered a balanced housing market.

Nationally, according to the quarterly all-transactions House Price Index (HPI) released by the Federal Housing Finance Agency (FHFA), U.S. house prices rose 5.4% in the fourth quarter of 2024, compared to the fourth quarter of 2023. The year-over-year rate has decreased from a high of 20.6% in the second quarter of 2022, but is higher than the previous quarter’s rate of 5.2%.

The quarterly FHFA HPI not only reports house prices at the national level but also provides insights about house price fluctuations at the state and metro area levels. The FHFA HPI used in this article is the all-transactions index, measuring average price changes in repeat sales or refinancings on the same single-family properties.  

Between the fourth quarter of 2023 and the fourth quarter of 2024, 49 states and the District of Columbia had positive house price appreciation. Vermont topped the house price appreciation list with an 8.9% gain, followed by New Jersey and Connecticut both with 8.3% gains. At the other end, Louisiana had the lowest house price appreciation (+2.1%), while Hawaii was the only state to experience a price decline (-4.3%). Among all 50 states and the District of Columbia, 31 states reached or exceeded the national growth rate of 5.4%. Compared to the third quarter of 2024, 32 out of the 50 states had an acceleration in house price appreciation in the fourth quarter.

House price growth widely varied across U.S. metro areas year-over-year, ranging from -4.9% to +24.7%. In the fourth quarter of 2024, 18 metro areas, in reddish color on the map above, had negative house price appreciation, while the remaining 366 metro areas experienced positive price appreciation. Punta Gorda, FL had the largest decline in house prices, while Cumberland, MD-WV saw the highest increase over the previous four quarters.

Additionally, house prices have increased dramatically since the COVID-19 pandemic. Nationally, house prices rose 53% between the first quarter of 2020 and the fourth quarter of 2024. More than half of metro areas saw house prices rise by more than the national price growth rate of 53%.

The table below shows the top and bottom ten markets for house price appreciation between the first quarter of 2020 and the fourth quarter of 2024. Among all the metro areas, house price appreciation ranged from 11.2% to 87.8%. Ocean City, NJ experienced the highest house price appreciation. Lake Charles, LA had the lowest appreciation for the third quarter in a row.

Discover more from Eye On Housing

Subscribe to get the latest posts sent to your email.


This article was originally published by a eyeonhousing.org . Read the Original article here. .


House prices posted modest annual growth for the third quarter of 2024, as elevated mortgage rates kept many potential home buyers away from the housing market. Nonetheless, housing inventory has improved in recent months.

Nationally, house price appreciation has decelerated for two straight quarters. According to the quarterly all-transactions House Price Index (HPI) released by the Federal Housing Finance Agency (FHFA), U.S. house prices rose 5.1% in the third quarter of 2024, compared to the third quarter of 2023.

The quarterly FHFA HPI not only reports house prices at the national level, but also provides insights about house price fluctuations at the state and metro area levels. The FHFA HPI used in this article is the all-transactions index, measuring average price changes in repeat sales or refinancings on the same single-family properties.  

Between the third quarter of 2023 and the third quarter of 2024, all 50 states and the District of Columbia had positive house price appreciation, ranging from 1.2% to 8.8%. New Jersey and Connecticut topped the house price appreciation list with an 8.8% gain. They were followed by Rhode Island with an 8.4% gain. Meanwhile, the District of Columbia had the lowest price growth (+1.2%). Among all 50 states and the District of Columbia, 29 states exceeded the national growth rate of 5.1%. Compared to the second quarter of 2024, 40 out of the 50 states had a deceleration in house price appreciation in the third quarter.

House prices have changed unevenly across U.S. metro areas, from the third quarter of 2023 to the third quarter of 2024. House price appreciation ranged from -9.0% to +19.1%. In the third quarter of 2024, 21 metro areas, in reddish color on the map above, had negative house price appreciation, while the remaining 363 metro areas experienced positive price appreciation.

Additionally, house prices have increased dramatically since the COVID-19 pandemic. Nationally, house prices rose 50.4% between the first quarter of 2020 and the third quarter of 2024. More than half of the metro areas saw house prices rise by more than the national price growth rate of 50.4%.

The table below shows the top and bottom ten markets for house price appreciation between the first quarter of 2020 and the third quarter of 2024. Among all the metro areas, house price appreciation ranged from 13.1% to 81.4%. Knoxville, TN has experienced the highest house price appreciation. Lake Charles, LA had the lowest appreciation.

Discover more from Eye On Housing

Subscribe to get the latest posts sent to your email.


This article was originally published by a eyeonhousing.org . Read the Original article here. .


The residential construction industry plays a crucial role in driving economic growth and local community development. It has a lasting impact on local communities by creating jobs, improving infrastructure, boosting local businesses, and enhancing property values.

The residential construction industry is more reliant on labor than capital in the United States. As of October 2024, about 3.4 million people work in the residential construction industry in the United States, with 957,000 builders and 2.4 million residential specialty trade contractors.

The NAHB analysis of the Quarterly Census of Employment and Wages (QCEW) data provides an insight into employment and establishment concentration of the residential construction industry across metro areas (MSA).

Location quotients (LQ) are ratios that compare the concentration of the residential construction industry within a metro area to the concentration of the industry nationwide. LQs are used in this article to evaluate the employment and establishment concentration of the residential construction industry in local areas.  

Employment

The March 2024 QCEW data indicates that employment in the residential construction industry, while found throughout the country, was more highly concentrated in some metro areas than others.

Among 387 metro areas, employment LQs ranged from 0.02 to 3.99. Cape Coral-Fort Myers, FL had the highest employment concentration of the residential construction industry with an LQ of 3.99. It was followed by Naples-Marco Island, FL (LQ: 3.47) and Bozeman, MT (LQ: 3.12).

Florida, experiencing a rapid growth in population, reported a relatively high employment concentration in residential construction. All metro areas in Florida had a higher employment concentration than the nation’s concentration. Moreover, half of the top ten metro areas with the highest employment concentrations of the residential construction industry were in Florida.

Various metro areas in the Mountain Division also have a high reliance on the residential construction industry for employment. Bozeman, MT (LQ: 3.12), St. George, UT (LQ: 3.03), Coeur d’Alene, ID (LQ: 2.51), and Provo-Orem-Lehi, UT (LQ: 2.35) were ranked in the top ten markets with a higher employment concentration of the residential construction industry.

Metro areas in the South reported the three lowest employment LQs of the residential construction industry. The lowest was Owensboro, KY with a LQ of 0.02, followed by Dalton, GA (LQ: 0.03) and Eagle Pass, TX (LQ: 0.05).

Establishment

On aggregate, New York-Newark-Jersey City, NY-NJ, Los Angeles-Long Beach-Anaheim, CA, and Miami-Fort Lauderdale-West Palm Beach, FL were the three metro areas that not only had the most employment in residential construction but also had the largest number of residential construction establishments among all metro areas. However, these three metro areas didn’t have higher establishment concentrations of the residential construction industry than the nation.

Among all the 387 metro areas, 104 of them had a higher establishment concentration of the residential construction industry than the nation. St. George, UT had the highest establishment concentration of the residential construction industry, which was more than three times that of the nation, followed by Barnstable Town, MA (LS: 2.42) and Cape Coral-Fort Myers, FL (LQ: 2.38).

The three metro areas in the South that reported the lowest employment LQs of the residential construction industry also had the lowest establishment LQs of the residential construction industry.

For more information on QCEW, please check the “Handbook of Methods” published by BLS.

Discover more from Eye On Housing

Subscribe to get the latest posts sent to your email.


This article was originally published by a eyeonhousing.org . Read the Original article here. .


This Austin, Texas, couple loved their home, but they did not love that it had no covered parking or place to safely store electric bikes, throw an outdoor party or let their French bulldog, Cash, roam free. They embarked on a long design journey with Dick Clark + Associates and Stephen Thomas Construction to add style and functionality to their steeply sloped front yard.

“This project required a variance, and the permitting process was long and challenging,” project manager Bob Perez says. “From the time the architects started the design to the time we finished building was about two years.” Luckily, the couple’s patience paid off. They now have a two-car carport, a protected bike garage, a reworked entry and an expanded patio that includes an outdoor kitchen, a covered area and full smart home technology outdoors for fans, heaters, lighting, speakers and misters.


This article was originally published by a www.houzz.com . Read the Original article here. .


I often get asked, “What are the rules in selecting the size of rug to use in a room?” Deciding what size rug is best for a space can be hard since there are many “rules” and just as many opposing opinions.

One popular rule is that the rug should be large enough to slide under the front legs of sofas and chairs in a seating arrangement, unifying the furniture. But just as frequently I’ve heard it suggested that all legs of the furniture should sit on the rug. So, rather than be bound by rules, be aware of the following guidelines and let them assist you in determining what size rug provides the visual effect you desire in the rooms of your house.


This article was originally published by a www.houzz.com . Read the Original article here. .


House price appreciation was recorded in all 50 states and the District of Columbia. Limited resale inventory and strong growth in demand continued to put upward pressure on house prices.

Nationally, house prices grew at a relatively slower pace, compared to double-digit annual growth during the COVID-19 pandemic. According to the quarterly all-transactions House Price Index (HPI) released by the Federal Housing Finance Agency (FHFA), U.S. house prices rose 5.9% in the second quarter of 2024, compared to the second quarter of 2023. This rate of price growth decreased from 6.4% in the first quarter of 2024.

The quarterly FHFA HPI not only reports house prices at the national level, but it also provides insights about house price fluctuations at the state and metro area levels. The FHFA HPI used in this article is the all-transactions index, measuring average price changes in repeat sales or refinancings on the same single-family properties.  

Between the second quarter of 2023 and the second quarter of 2024, all 50 states and the District of Columbia had positive house price appreciation, ranging from 1.5% to 10.4%. West Virginia led the way with the highest price appreciation (+10.4%). It was followed by New Jersey with a 10.1% gain, and New Hampshire with a 9.1% gain. Meanwhile, Louisiana had the lowest price growth (+1.5%). Among all 50 states and the District of Columbia, 28 states exceeded the national growth rate of 5.9%. Compared to the first quarter of 2024, thirty-five out of the 50 states had a deceleration in house price appreciation in the second quarter.

House prices have changed unevenly across U.S. metro areas, from the second quarter of 2023 to the second quarter of 2024. House price appreciation ranged from -4.6% to +20.7%. In the second quarter of 2024, 14 metro areas, in reddish color on the map above, had negative house price appreciation, while the remaining 370 metro areas experienced positive price appreciation.

Meanwhile, house prices in the second quarter of 2024 are much higher than they were before the pandemic. Nationally, house prices rose 49.7% between the first quarter of 2020 and the second quarter of 2024. More than half of the metro areas saw house prices rise by more than the national price growth rate of 49.7%. Among all the metro areas, house price appreciation ranged from 13.8% to 81.0%. House prices in the South and the West have grown faster than the prices in the Midwest and Northeast. Within the top 20 metro areas that had the highest house price appreciation, 11 metro areas are in the South Atlantic Division and six in the East South Central Division, while none were in the Midwest.

Discover more from Eye On Housing

Subscribe to get the latest posts sent to your email.


This article was originally published by a eyeonhousing.org . Read the Original article here. .

Pin It