Tag

April

Browsing


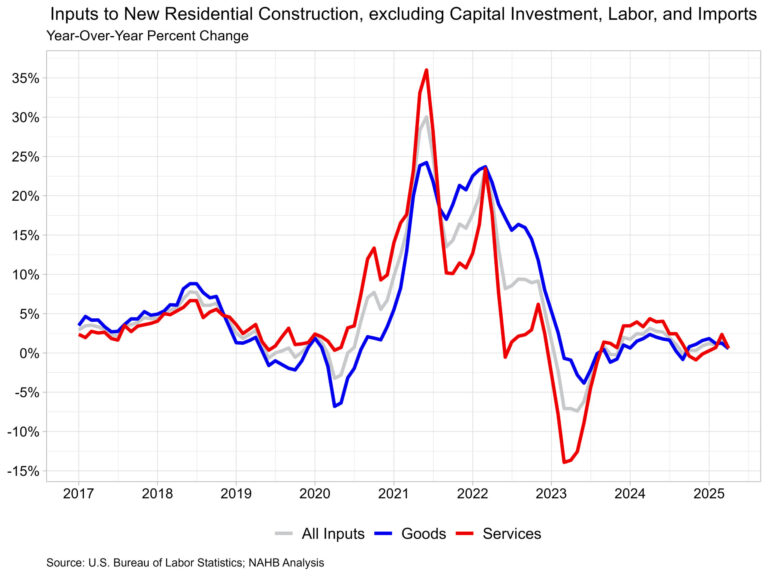
Housing permits continued a downhill trend for the fourth month in a row, pointing to a broader residential construction slowdown for 2025. Over the first four months of 2025, the total number of single-family permits issued year-to-date (YTD) nationwide reached 320,259. On a year-over-year (YoY) basis, this is a decline of 4.7% over the April 2024 level of 336,124. For multifamily, the total number of permits issued nationwide reached 154,668. This is 1.5% below the April 2024 level of 157,076.

Year-to-date ending in April, single-family permits were down in three out of the four regions. The Northeast posted an increase of 5.7%. The Midwest was down by 0.6%, the West was down by 5.6%, and the South was down by 6.1% in single-family permits during this time. For multifamily permits, three out of the four regions posted increases. The Midwest was up by 16.7%, the South was up by 6.2%, and the West was up by 3.7%. Meanwhile, the Northeast declined steeply by 37.7%.

Between April 2025 YTD and April 2024 YTD, 18 states posted an increase in single-family permits. The range of increases spanned 27.0% in Hawaii to 0.2% in Maine. The remaining 32 states and the District of Columbia reported declines in single-family permits with New Mexico reporting the steepest decline of 27.5%.

The ten states issuing the highest number of single-family permits combined accounted for 63.6% of the total single-family permits issued. Texas, the state with the highest number of single-family permits, issued 52,654 permits over the first four months of 2025; This is a decline of 7.4% compared to the same period last year. The second highest state, Florida, decreased by 9.3%, while the third highest, North Carolina, posted a decline of 1.5%.

Between April 2025 YTD and April 2024 YTD, 26 states recorded growth in multifamily permits, while 24 states and the District of Columbia recorded a decline. Alaska (+312.5%) led the way with a sharp rise in multifamily permits from 24 to 99, while New York had the biggest decline of 58.7% from 14,389 to 5,946.

The ten states issuing the highest number of multifamily permits combined accounted for 61.1% of the multifamily permits issued. Over the first four months of 2025, Florida, the state with the highest number of multifamily permits issued, experienced an increase of 18.7%. Texas, the second-highest state in multifamily permits, saw an increase of 6.8%. California, the third largest multifamily issuing state, increased by 0.2%.

At the local level, below are the top ten metro areas that issued the highest number of single-family permits.

For multifamily permits, below are the top ten local areas that issued the highest number of permits.

Discover more from Eye On Housing

Subscribe to get the latest posts sent to your email.


This article was originally published by a eyeonhousing.org . Read the Original article here. .
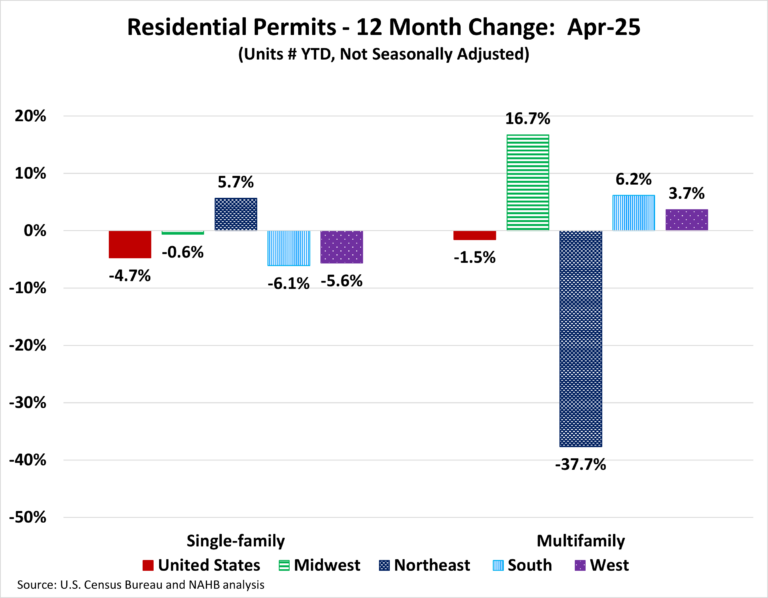

The count of open, unfilled positions in the construction industry held steady amid a slowdown for housing, per the April Bureau of Labor Statistics Job Openings and Labor Turnover Survey (JOLTS).

The number of open jobs for the overall economy increased slightly from 7.20 million in March to 7.39 million in April. This is notably smaller than the 7.62 million estimate reported a year ago and reflects a softened aggregate labor market. Previous NAHB analysis indicated that this number had to fall below 8 million on a sustained basis for the Federal Reserve to move forward on interest rate reductions. With estimates remaining below 8 million for national job openings, the Fed, in theory, should be able to cut further despite a recent pause. However, tariff proposals may keep the Fed on pause in the coming quarters.

The number of open construction sector jobs was effectively unchanged from a revised 251,000 in March to 248,000 in April. This nonetheless marks a significant reduction of open, unfilled construction jobs than that registered a year ago (326,000) due to a slowing of construction activity. The chart below notes the recent decline for the construction job openings rate, which is now back to the lows of 2019.

The construction job openings rate was unchanged at 2.9% in April, although significantly lower year-over-year from 3.8%.

The layoff rate in construction ticked higher to 1.9% in April. The quits rate dipped to 1.8% for the month.

Discover more from Eye On Housing

Subscribe to get the latest posts sent to your email.


This article was originally published by a eyeonhousing.org . Read the Original article here. .
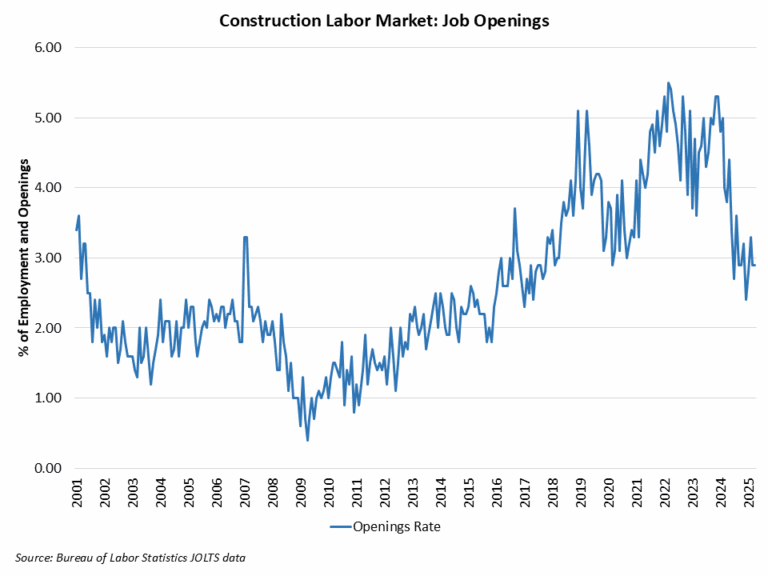

Private residential construction spending fell by 0.9% in April, marking the third consecutive monthly decline. This decrease was primarily driven by reduced spending in single-family construction and home improvements. Compared to a year ago, total spending was down 4.8%, as the housing sector continues to navigate the economic uncertainty stemming from ongoing tariff concerns and elevated mortgage rates.

According to the latest U.S. Census Construction Spending data, single-family construction spending declined by 1.1% in April. This decrease aligns with the weakness in the April single-family starts and NAHB/Wells Fargo Housing Market Index (HMI). The April data ends seven months of growth in single-family construction spending, making it 2.2% lower than a year ago. Meanwhile improvement spending was down 0.8% in April and was 5.5% lower on a year-over-year basis. Multifamily construction spending edged down 0.1% in April, staying in the downward trend that began in December 2023. Compared to April 2024, multifamily spending was down 11.3%.

The NAHB construction spending index is shown in the graph below. The index illustrates how   spending on single-family construction has slowed since early 2024 under the pressure of elevated interest rates and concerns over building material tariffs. Multifamily construction spending growth has also slowed down after the peak in July 2023. Improvement spending has also been weakening since the beginning of 2025.

Spending on private nonresidential construction was up 1% over a year ago. The annual private nonresidential spending increase was mainly due to higher spending for the class of power ($7.9 billion), followed by the office category ($3.3 billion).

Discover more from Eye On Housing

Subscribe to get the latest posts sent to your email.


This article was originally published by a eyeonhousing.org . Read the Original article here. .
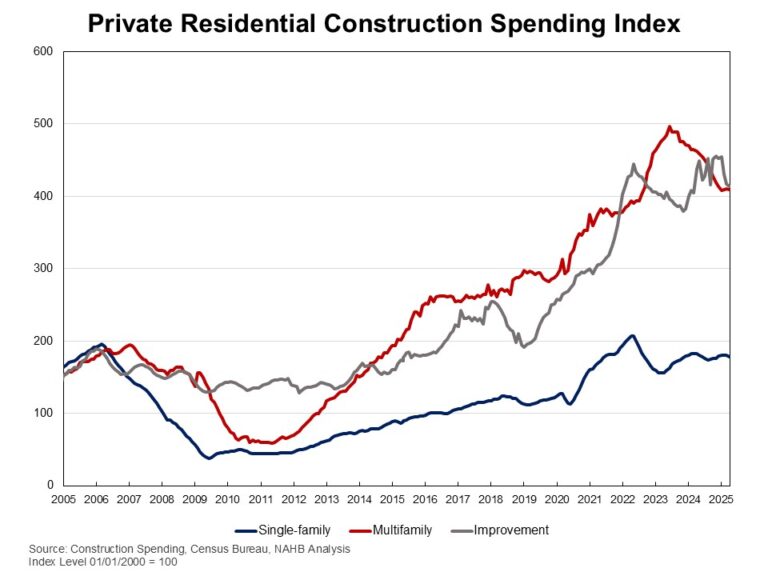

Prices for inputs to new residential construction—excluding capital investment, labor, and imports—fell 0.4% in April, following a (revised) increase of 0.8% in March. These figures are taken from the most recent Producer Price Index (PPI) report published by U.S. Bureau of Labor Statistics. The PPI measures prices that domestic producers receive for their goods and services; this differs from the Consumer Price Index which measures what consumers pay and includes both domestic products as well as imports.

The inputs to the New Residential Construction Price Index grew 0.6% from April of last year. The index can be broken into two components­—the goods component also increased 0.6% over the year, with services increasing 0.6% as well. For comparison, the total final demand index, which measures all goods and services across the economy, increased 2.4% over the year, with final demand with respect to goods up 0.5% and final demand for services up 3.3% over the year.

Input Goods Prices

The goods component has a larger importance to the total residential construction inputs price index, representing around 60%. For the month, the price of input goods to new residential construction was down 0.2% in April.

The input goods to residential construction index can be further broken down into two separate components, one measuring energy inputs with the other measuring goods less energy inputs. The latter of these two components simply represents building materials used in residential construction, which makes up around 93% of the goods index.

Energy input prices were up 0.1% between March and April but were 17.6% lower than one year ago. Building material prices were down 0.3% between March and April but up 2.2% compared to one year ago. Energy costs have continued to fall on a year-over-year basis, as this marks the ninth consecutive month of lower input energy costs.

Input Services Prices

Prices for service inputs to residential construction reported its first monthly decline in five months, down 0.6% in April. On a year-over-year basis, service input prices are up 0.6%.

The price index for service inputs to residential construction can be broken out into three separate components: a trade services component, a transportation and warehousing services component, and a services excluding trade, transportation and warehousing component (other services). The most significant component is trade services (around 60%), followed by other services (around 29%), and finally transportation and warehousing services (around 11%). The largest component, trade services, was up 0.2% from a year ago. The other services component was up 1.4% over the year. Lastly, prices for transportation and warehousing services advanced 0.6% compared to April last year.

Discover more from Eye On Housing

Subscribe to get the latest posts sent to your email.


This article was originally published by a eyeonhousing.org . Read the Original article here. .

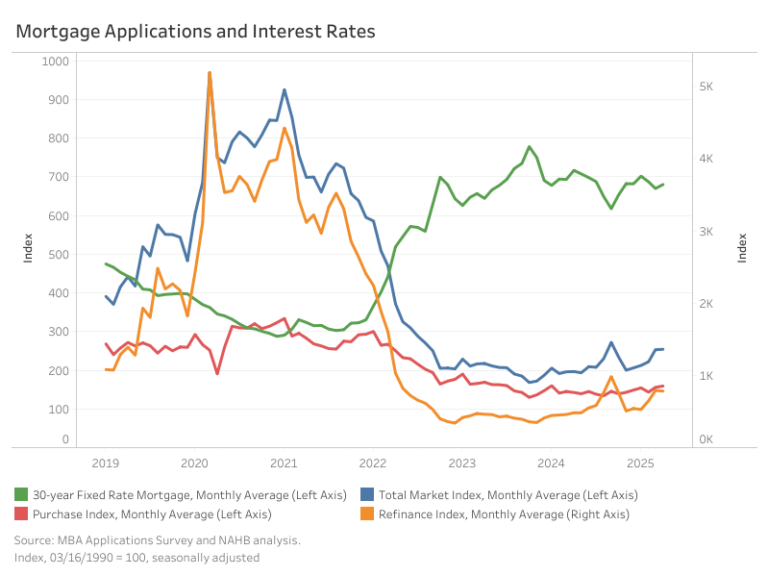
Nonfarm payroll employment increased in 40 states in April compared to the previous month, while it decreased in 10 states and the District of Columbia. According to the Bureau of Labor Statistics, nationwide total nonfarm payroll employment increased by 177,000 in April following a gain of 185,000 jobs in March.

On a month-over-month basis, employment data was most favorable in Texas, which added 37,700 jobs. Ohio came in second (+22,200), followed by Florida (+21,300). Meanwhile, a total of 21,100 jobs were lost across 10 states, with Missouri reporting the steepest job losses at 6,600. In percentage terms, employment increased the highest in Arizona at 0.4%, while Missouri saw the biggest decline at 0.2% between March and April.

Year-over-year ending in April, 1.9 million jobs have been added to the labor market, which is a 1.2% increase compared to the April 2024 level. The range of job gains spanned from 800 jobs in Montana to 215,500 jobs in Texas. Two states and the District of Columbia lost a total of 4,500 jobs in the past 12 months, with Iowa reporting the steepest job losses at 3,100. In percentage terms, the range of job growth spanned 2.7% in Hawaii to 0.1% in Missouri. The District of Columbia, West Virginia, and Iowa declined by 0.1%, 0.1%, and 0.2% respectively.

Construction Employment

Across the nation, construction sector jobs data —which includes both residential and non-residential construction—showed that 24 states reported an increase in April compared to March, while 24 states and the District of Columbia lost construction sector jobs. The two remaining states, Indiana and New York reported no change on a month-over-month basis. California, with the highest increase, added 6,300 construction jobs, while Washington, on the other end of the spectrum, lost 3,300 jobs. Overall, the construction industry added a net 11,000 jobs in April compared to the previous month. In percentage terms, Virginia reported the highest increase at 1.9% and Alaska reported the largest decline at 3.1%.

Year-over-year, construction sector jobs in the U.S. increased by 143,000, which is a 1.7% increase compared to the April 2024 level. Texas added 32,000 jobs, which was the largest gain of any state, while Washington lost 15,000 construction sector jobs. In percentage terms, New Mexico had the highest annual growth rate in the construction sector at 14.6%. Over this period, Washington reported the largest decline of 6.6%.

Discover more from Eye On Housing

Subscribe to get the latest posts sent to your email.


This article was originally published by a eyeonhousing.org . Read the Original article here. .
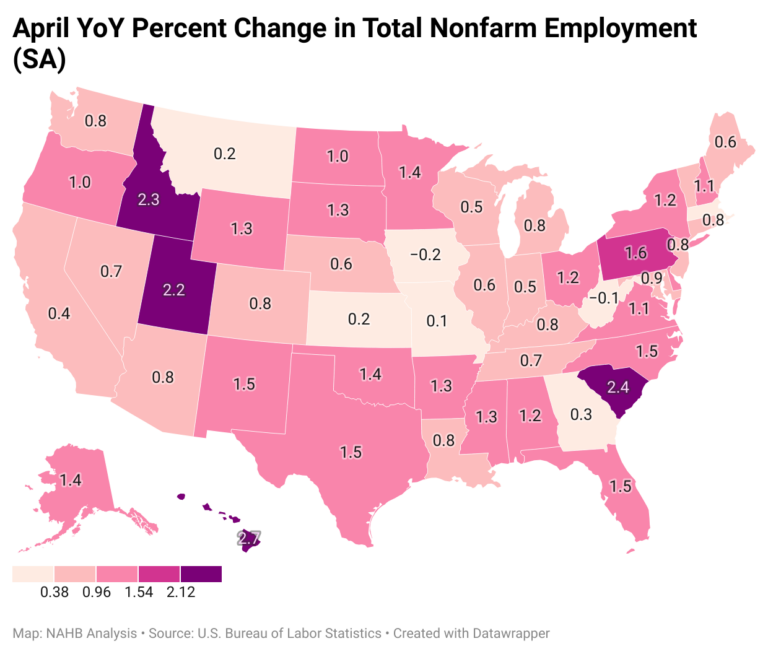

Despite the brief retreat in mortgage rates and increased supply, existing home sales dropped to 7-month low in April, according to the National Association of Realtors (NAR). This unexpected decline suggests buyers’ activity continues to be constrained by economic uncertainty and ongoing affordability challenges even with improved market conditions.

While existing home inventory improved , the market faces headwinds as mortgage rates are expected to stay above 6% for longer due to an anticipated slower easing pace in 2025. These prolonged higher rates may continue to discourage homeowners from trading existing mortgages for new ones with higher rates, keeping supply tight and prices elevated. As such, sales are likely to remain limited in the coming months due to elevated mortgage rates and home prices.

Total existing home sales, including single-family homes, townhomes, condominiums, and co-ops, fell 0.5% to a seasonally adjusted annual rate of 4.00 million in April. On a year-over-year basis, sales were 2.0% lower than a year ago.

The first-time buyer share was 34% in April, up from 32% in March and 33% from a year ago.

The existing home inventory level was 1.45 million units in April, up 9.0% from March, and up 20.8% from a year ago. At the current sales rate, April unsold inventory sits at a 4.4-months’ supply, up from 4.0-months in March and 3.5-months in April 2024. This inventory level remains low compared to balanced market conditions (4.5 to 6 months’ supply), but it increases growing competition for home builders.

Homes stayed on the market for an average of 29 days in April, down from 36 days in March but up from 26 days in April 2024.

The April all-cash sales share was 25% of transactions, down from 26% in March and 28% a year ago. All-cash buyers are less affected by changes in interest rates.

The April median sales price of all existing homes was $414,000, up 1.8% from last year. This marked an all-time high for the month and the 22nd consecutive month of year-over-year increases. The median condominium/co-op price in April was up 1.4% from a year ago at $370,100. This rate of price growth will slow as inventory increases. Existing home sales in April were mixed across the four major regions. Sales fell in the West (-3.9%) and Northeast (-2.0%), rose in the Midwest (2.1%), and remained unchanged in the South. On a year-over-year basis, sales were down in the Midwest (-1.0%), South (-3.2%) and West (-1.3%), while remaining flat in the Northeast.

The Pending Home Sales Index (PHSI) is a forward-looking indicator based on signed contracts. The PHSI jumped from 72.1 to 76.5 in March, the largest monthly increase since December 2023. This increase suggests homebuyers are highly sensitive to even small changes in mortgage rates. On a year-over-year basis, pending sales were 0.6% lower than a year ago, per National Association of Realtors data.

Discover more from Eye On Housing

Subscribe to get the latest posts sent to your email.


This article was originally published by a eyeonhousing.org . Read the Original article here. .
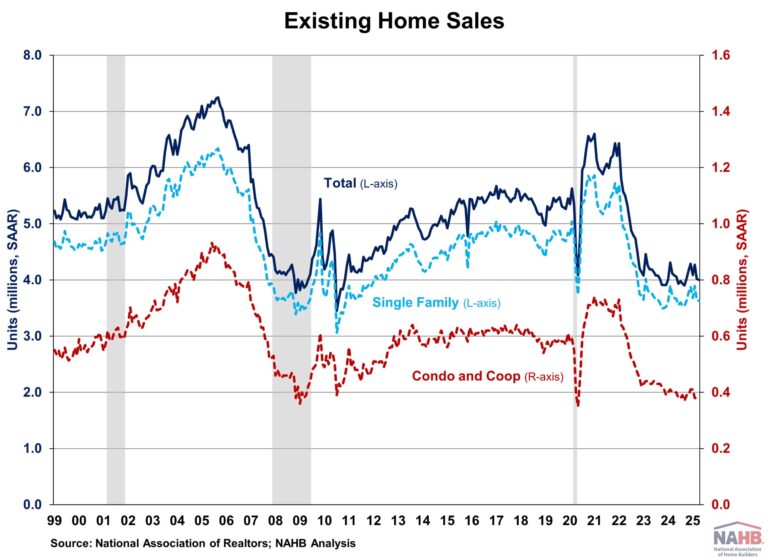

Inflation slowed to a 4-year low in April while shelter inflation remained elevated. Despite the easing, inflation may pick up in the coming months as possible inflationary pressure from enacted tariffs and other policy uncertainties continues to threaten economic growth and complicate the Fed’s path to its 2% target. Meanwhile, housing inflation remains elevated, but it continues to show signs of cooling – the year-over-year change in the shelter index remained below 5% for an eighth straight month, matching last month’s lowest level since November 2021. 

While the Fed’s interest rate cuts could help ease some pressure on the housing market, its ability to address rising housing costs is limited, as these increases are driven by a lack of affordable supply and increasing development costs. In fact, tight monetary policy hurts housing supply because it increases the cost of AD&C financing. This can be seen on the graph below, as shelter costs continue to rise at an elevated pace despite Fed policy tightening. Additional housing supply is the primary solution to tame housing inflation and with it, overall inflation. This emphasizes why the cost of construction, including the cost of building materials, matters not just for housing but also the inflation outlook and the path of future monetary policy.

Consequently, the election result has put inflation back in the spotlight and added additional upside and downside risks to the economic outlook. Proposed tax cuts and tariffs could increase inflationary pressures, suggesting a more gradual easing cycle with a slightly higher terminal federal funds rate. However, economic growth could also be higher with lower regulatory burdens. Given the housing market’s sensitivity to interest rates, a higher inflation path could extend the affordability crisis and constrain housing supply as builders continue to grapple with lingering supply chain challenges.

During the past twelve months, on a non-seasonally adjusted basis, the Consumer Price Index rose by 2.3% in April, smallest increase since February 2021, according to the Bureau of Labor Statistics’ report. This followed a 2.4% year-over-year increase in March. Excluding the volatile food and energy components, the “core” CPI increased by 2.8% over the past twelve months. A large portion of the “core” CPI is the housing shelter index, which increased 4.0% over the year.  Meanwhile, the component index of food rose by 2.8%, and the energy component index fell by 3.7%.

On a monthly basis, the CPI rose by 0.2% in April (seasonally-adjusted), after a 0.1% decline in March. The “core” CPI increased by 0.2% in April.

The price index for a broad set of energy sources rose by 0.7% in April, with increases in natural gas (3.7%) and electricity (0.8%) offset by decline in gasoline (-0.1%). Meanwhile, the food index fell 0.1%, after a 0.4% increase in March. The index for food away from home increased by 0.4% and the index for food at home decreased by 0.4%.

The index for shelter (+0.3%) was the largest contributor to the monthly increase in all items index, accounting for more than half of the total increase. Other top contributors that rose in April include indexes for household furnishings and operations (+1.0%), medical care (+0.5%), motor vehicle insurance (+0.6%), education (+0.1%), as well as personal care (+0.1%). Meanwhile, the index for airline fares (-2.8%) and used cars and trucks (-0.5%)were among the few major indexes that decreased over the month.

The index for shelter makes up more than 40% of the “core” CPI, rose by 0.3% in April, following an increase of 0.2% in March. The index for owners’ equivalent rent (OER) rose by 0.4% and index for rent of primary residence (RPR) increased by 0.3% over the month. Despite the moderation, shelter costs remained the largest contributors to headline inflation. 

NAHB constructs a “real” rent index to indicate whether inflation in rents is faster or slower than core inflation. It provides insight into the supply and demand conditions for rental housing. When inflation in rents is rising faster than core inflation, the real rent index rises and vice versa. The real rent index is calculated by dividing the price index for rent by the core CPI (to exclude the volatile food and energy components).

In April, the Real Rent Index rose by 0.1%. Over the first four months of 2025, the monthly growth rate of the Real Rent Index averaged at 0.1%, higher than 0.0% from the same period in 2024.

Discover more from Eye On Housing

Subscribe to get the latest posts sent to your email.


This article was originally published by a eyeonhousing.org . Read the Original article here. .
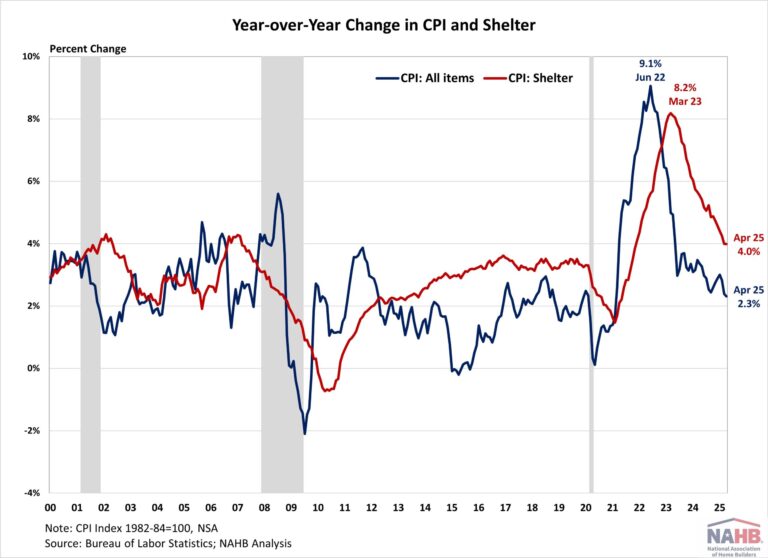

Mortgage loan applications saw little change in April, as refinancing activity decreased. The Market Composite Index, which measures mortgage loan application volume based on the Mortgage Bankers Association (MBA) weekly survey, experienced a 0.4% month-over month increase on a seasonally adjusted (SA) basis. However, year-over-year, the index is up 29.3% compared to April 2024.

The average rate for a 30-year fixed mortgage climbed 10 basis points in April, reaching 6.8%, according to the MBA survey. As rates edged higher, purchase activity posted a modest 1.9% month-over-month gain (SA), while the Refinance Index declined by 1.4% (SA). Compared to a year ago, mortgage rates are down 37 bps, and thus, purchase applications are higher by 11.2%, while refinance activity has jumped 62.0%.

Loan sizes remained relatively stable. In April, the average loan size across the total market (including purchases and refinances) held steady at $403,500, month-over-month, on a non-seasonally adjusted basis (NSA). Purchase loans sizes edged down 1.3% to $444,000, while refinance loan sizes increased 0.5% to $339,300. Notably, the average loan size for adjustable-rate mortgages (ARMs) fell 7.8%, from $1.14 million to $1.05 million.

Discover more from Eye On Housing

Subscribe to get the latest posts sent to your email.


This article was originally published by a eyeonhousing.org . Read the Original article here. .

The U.S. job market slowed slightly in April, with notable downward revisions to February and March figures. The unemployment rate held steady at 4.2%. The labor market remains resilient despite growing economic uncertainty, though early signs of softening are beginning to emerge.

In April, wage growth remained unchanged. Year-over-year, wages grew at a 3.8% rate. Wage growth has been outpacing inflation for nearly two years, which typically occurs as productivity increases.

National Employment

According to the Employment Situation Summary reported by the Bureau of Labor Statistics (BLS), total nonfarm payroll employment rose by 177,000 in April, following a downwardly revised increase of 185,000 jobs in March. Since January 2021, the U.S. job market has added jobs for 52 consecutive months, making it the third-longest period of employment expansion on record. Monthly employment growth has averaged 144,000 per month in 2025, compared with the 168,000 monthly average gain for 2024.

The estimates for the previous two months were revised down. The monthly change in total nonfarm payroll employment for February was revised down by 15,000 from +117,000 to +102,000, while the change for March was revised down by 43,000 from +228,000 to +185,000. Combined, the revisions were 58,000 lower than previously reported.

The unemployment rate remained unchanged at 4.2% in April. While the number of employed persons increased by 436,000, the number of unemployed persons increased by 82,000.

Meanwhile, the labor force participation rate—the proportion of the population either looking for a job or already holding a job—rose one percentage point to 62.6%. Among individuals aged 25 to 54, the participation rate rose three percentage points to 83.6%, marking the highest rate since September 2024. Despite these gains, the overall labor force participation rate remains below its pre-pandemic levels of 63.3% at the beginning of 2020. Additionally, the rate for the prime working-age group (25 to 54) has been trending downward since peaking at 83.9% last summer.

In April, industries like health care (+51,000), transportation and warehousing (+29,000), and financial activities (+14,000) continued to see gains. Meanwhile, federal government employment lost 9,000 jobs in April and has shed 26,000 since January 2025, reflecting the effects of government cutbacks. The BLS notes that “employees on paid leave or receiving ongoing severance pay are counted as employed in the establishment survey.”

Construction Employment

Employment in the overall construction sector increased by 11,000 in April, following a downwardly revised gain of 7,000 in March. While residential construction gained 3,400 jobs, non-residential construction employment added 8,000 jobs for the month.

Residential construction employment now stands at 3.3 million in April, broken down as 956,000 builders and 2.4 million residential specialty trade contractors. The six-month moving average of job gains for residential construction was -1,583 a month, mainly reflecting the three months’ job loss over the past six months (October 2024, January 2025, and March 2025). Over the last 12 months, home builders and remodelers added 5,000 jobs on a net basis. Since the low point following the Great Recession, residential construction has gained 1,367,000 positions.

In April, the unemployment rate for construction workers rose to 5.2% on a seasonally adjusted basis. The unemployment rate for construction workers has remained at a relatively lower level, after reaching 15.3% in April 2020 due to the housing demand impact of the COVID-19 pandemic.

Discover more from Eye On Housing

Subscribe to get the latest posts sent to your email.


This article was originally published by a eyeonhousing.org . Read the Original article here. .


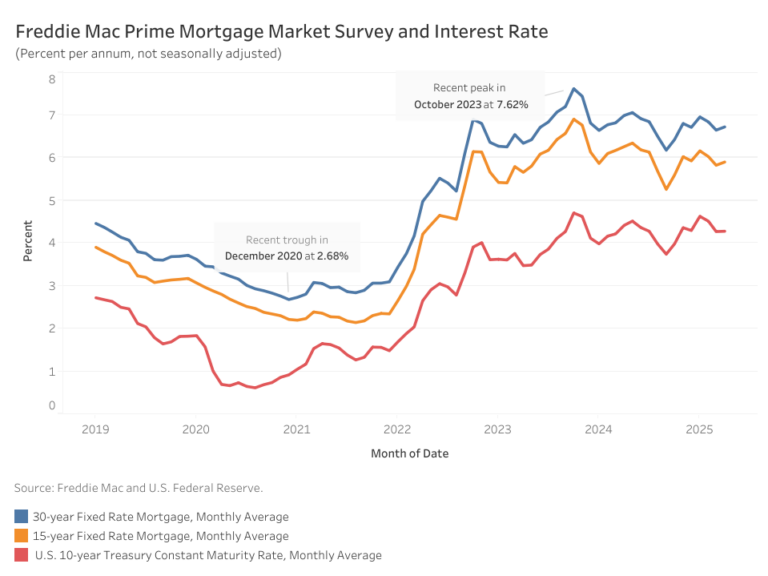
Mortgage rates edged up slightly in April, with the average 30-year fixed-rate mortgage settling at 6.73%, according to Freddie Mac. This marks an 8-basis-point (bps) increase from March. The 15-year fixed-rate mortgage increased by 7 bps to 5.90%.

The uptick in mortgage rates followed a sell-off in U.S. Treasury securities, driven by concerns surrounding the ongoing trade war. As demand for Treasuries declined, prices fell and yields rose. The 10-year Treasury yield averaged 4.28% in April, with the most recent weekly yield rising to 4.34%. The sell-off signals a potential loss of investor confidence in what is typically considered a safe-haven asset.

In response to rising yields, the president has pressured Federal Reserve Chair Jerome Powell to cut interest rates. However, at the recent Economic Club of Chicago, Chairman Powell stated that “tariffs are highly likely to generate at least a temporary rise in inflation” and emphasized the Fed’s obligation to price stability, adding that it must ensure “a one-time increase in the price level does not become an ongoing inflation problem”.

Discover more from Eye On Housing

Subscribe to get the latest posts sent to your email.


This article was originally published by a eyeonhousing.org . Read the Original article here. .
Pin It