Tag

Apartments

Browsing


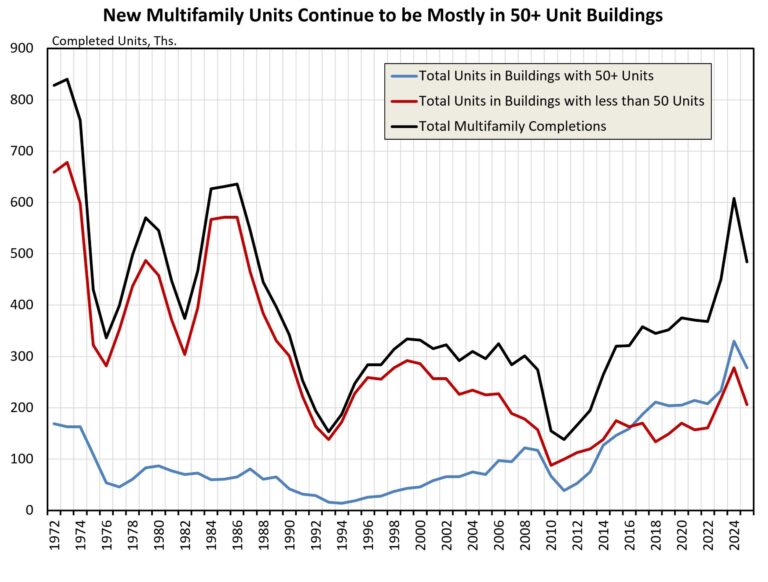
Following the highest number of multifamily completions in nearly 40 years in 2024, completions declined in 2025 to 484,000, according to NAHB analysis of the Census Bureau’s Survey of Construction. For the ninth consecutive year, a majority of new multifamily units were in buildings with 50 or more units (labeled as high-density buildings) at 57%, the highest share since 2021.

Dating back to the earliest estimates in the series (1972), multifamily units have historically been built in buildings with less than 50 units (low-medium density buildings). This trend reversed in 2017 and has remained unchanged through 2025, with a majority of new multifamily units being located in high-density buildings. Of the total 484,000 multifamily units completed in 2025, 278,000 (57%) were in high-density buildings while the remaining 206,000 (43%) were in low-medium density buildings.

Regional Distribution

The South continued to be the leading region in terms of units completed, down from 292,000 in 2024 to 217,000 completions in 2025. The South accounted for 45% of the total multifamily completions; the West held 26% (127,000), the Northeast 16% (79,000), and the Midwest 13% (63,000). The Midwest was the only region where low-medium density completions outpaced those in high-density buildings. The Midwest had 38,000 completions in low-medium density compared to 25,000 units in high-density buildings.

Conversely, the South, West and Northeast had more high-density completions than completions in low-medium density buildings. For the South, there were 122,000 units in high-density buildings and 95,000 low-medium density units. The West had 74,000 units in high-density buildings and 53,000 low-medium density units. The Northeast featured the largest divergence with 58,000 high-density units and 21,000 low-medium density.

As a share of regional completions, units in high-density buildings reached a new high in the Northeast at 73%. In the South, this share was up from 50% in 2024 to 56% in 2025. The West saw a similar rise, from 50% to 58% in 2025. The Midwest was the only region where this share declined, from 67% in 2024 to just 40% of completions in 2025.

Built-for-Rent

Among multifamily units completed in 2025, 95% were built-for-rent at 461,000. Over half of these units (59%) were in a building with 50 units or more, the highest share since 2021 (59%). This was the ninth straight year where most of multifamily rental-units were in high-density buildings. The second largest share was split between 30-49 unit buildings and 20-29 unit buildings, as both represented 15% of completed units in 2025. No other building category accounted for over 10% of completions in 2025.

Built-for-Sale

The number of multifamily units built-for-sale fell from 29,000 in 2024 to 23,000 in 2025. High-density buildings continued to be the primary type of building where these units were built, with 32% of built-for-sale units being completed in buildings with 50+ units. This share was down from 40% in 2024. The largest gain in market share for multifamily built-for-sale units was for buildings with 10-19 units, rising from 13% in 2024 to 24% in 2025 and making it the second largest segment of multifamily units built-for-sale.


This article was originally published by a eyeonhousing.org . Read the Original article here. .

In 2024, most new single-family homes included laundry connections on the first floor (70%), according to the Census Bureau’s Survey of Construction. The first floor is also where most customers prefer to have the laundry, as shown in Chapter 2 of What Home Buyers Really Want.     

The second floor was the next most common location, accounting for 28% of new single-family homes, while laundry areas in the basement accounted for just 2%. The share of new homes with laundry in any other location was negligible. 

Across all Census Divisions, the first floor remains the most common location for laundry, even in regions where two-story homes are more prevalent. Nevertheless, some regional differences exist. In the West South Central division, 91% of homes had a laundry area on the first floor, compared to just 51% in the Pacific division. Meanwhile, a second-floor laundry was most popular in the Pacific division at 46%, and least common in the West South Central at 8%. 

Not surprisingly, laundry connections in basements are more common in areas of the country where basements themselves are more common: primarily in the northern regions. The West North Central division led with 14% of homes featuring a basement laundry, followed by New England at 9%. These two divisions are also among the few where most new homes include a full or partial basement.  

Among age-restricted homes, where accessibility and main-level living are key design priorities, 93% featured laundry on the first floor. 

Multifamily Laundry Trends

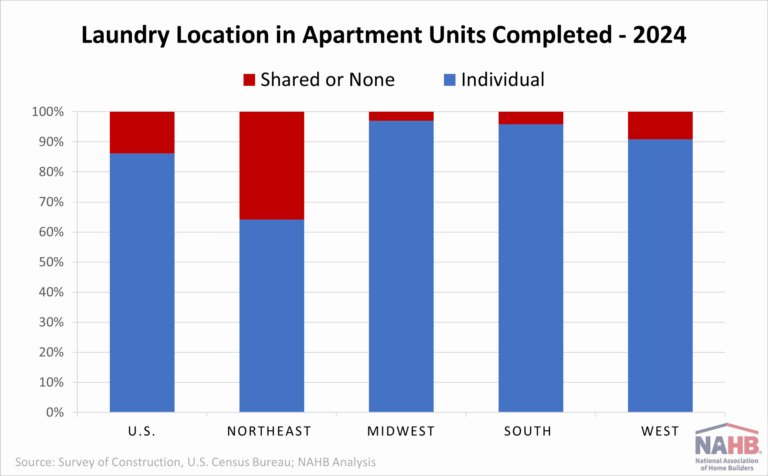
For multifamily units completed in 2024, 88% of apartments included an individual laundry, while 12% offered shared or no laundry facilities. This share has remained relatively stable since 2015, reflecting continued renter demand for in-unit laundry. 

Regionally, the Northeast has the highest shared or no laundry facilities percentage at 33%. In contrast, shared or no laundry facilities remained far less common elsewhere: 3% in the Midwest, 4% in the South, and 9% in the West. 

The pattern extends to the built-for-rent (BFR) segment, where 88% of units had an individual laundry, unchanged from the prior two years. In contrast, built-for-sale multifamily units saw a decrease—from 92% with individual laundry in 2023 to 81% in 2024—suggesting a possible shift toward more affordable condo projects, which are more likely to include shared facilities. 

Discover more from Eye On Housing

Subscribe to get the latest posts sent to your email.


This article was originally published by a eyeonhousing.org . Read the Original article here. .
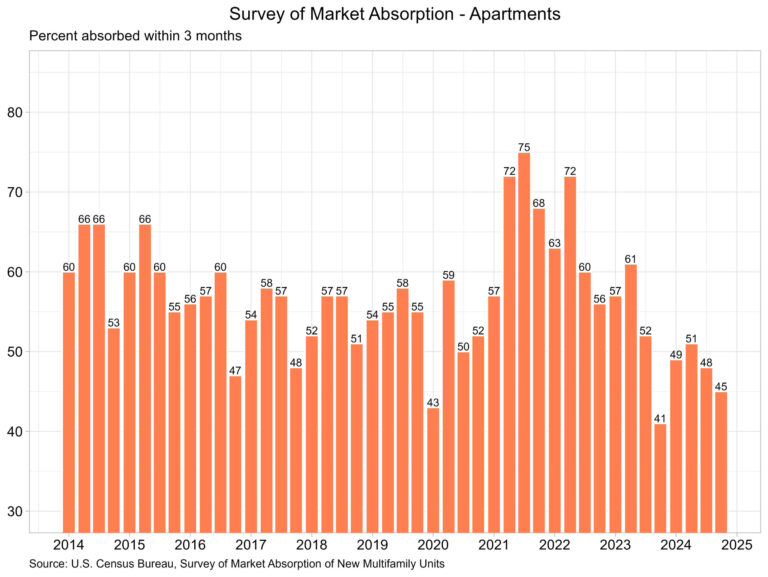

The percentage of new apartment units that were absorbed within three months after completion continued to trend lower, according to the Census Bureau’s latest release of the Survey of Market Absorption of New Multifamily Units (SOMA). The survey covers new units in multifamily residential buildings with five or more units. The number of new multifamily units completed pulled back slightly in the fourth quarter of 2024 but remained elevated near historical highs after posting a third straight quarter of above 100,000 completions.  

Apartments

The percentage of apartments absorbed within three months has fallen significantly from its peak of 75% in the third quarter of 2021, as shown in the graph above. Currently, the rate stands at 45%, coupled with 126,100 units completed in the fourth quarter of 2024. The large number of units completed each quarter continues to be a positive sign on the overall inflation front, as shelter inflation remains stubbornly high. More new apartments should help slow rent growth to lower levels in the coming months.

Along with the three-month absorption rate and completions, SOMA reports absorption rates within six-months, nine-months, and 12-months of completion. Solely focusing on the 12-month absorption rate, it remained at its lowest level since the start of the pandemic, registering a rate of just 90%. This means that 10% of the 99,850 apartments completed in the first quarter of 2024 remain unoccupied a year after completion. Regional SOMA data indicates that apartments completed over a year ago remain unoccupied primarily in the Midwest (12%) and the South (12%). The Northeast reported only 2%, while the West reported 6%.

Condominiums and Cooperative Units

The 3-month absorption rate for new condominiums and cooperative units rose one percentage point up to 67%. Total completions of new condominiums and cooperative units, according to the SOMA, fell in the fourth quarter from 4,793 to 2,880. Completions of these units peaked in the second quarter of 2018 at 7,996 and has steadily fallen since then.

Discover more from Eye On Housing

Subscribe to get the latest posts sent to your email.


This article was originally published by a eyeonhousing.org . Read the Original article here. .

Pin It