Tag

Americas

Browsing


American housing market is facing a persistent shortage. Home prices have reached historic highs and affordability has declined. Normally, in response to higher prices, housing supply would increase. However, new home construction has not kept pace with population growth and household formation, especially following the surge of demand in the wake of the pandemic. Recent research has claimed that the relationship between prices and supply has become diluted over time because of regulatory barriers and political dynamics. 

 A recent working paper “America’s Housing Supply Problem: the Closing of the Suburban Frontier?” by economist Edward Glaser and Joseph Gyourko, took a deep dive into why the supply of new housing has shifted lower, especially in the sunbelt regions like Dallas, Atlanta, and Phoenix. These areas, which once led the nation in new home construction, are now seeing a sharp slowdown.  

This research showed that the once-strong link between increasing home prices and new home constructions has weakened or even reversed in many metro areas. The authors analyzed Census tract data from the 1970s to the 2010 to track how construction has responded to price changes over time. Housing markets that used to expand rapidly in response to higher prices are now largely unresponsive. This breakdown in market dynamics reflects the growing influence of regulatory barriers and political constraints. 

Land use regulations, zoning restrictions, and permitting processes have become more restrictive since the 2000s. These constraints increase the cost and difficulty of building new homes, even as home prices increase. Therefore, housing supply is less responsive to demand. The latest NAHB study on this topic shows that regulations now account for nearly $94,000 of the average new home price. Furthermore, housing supply is becoming endogenous or determined by local socioeconomic dynamics. As neighborhoods become more affluent, wealthier or in some cases higher educated, residents are more likely to oppose new development through changing the permit environment or increasing zoning restrictions. In effect, demand is no longer driving the supply through NIMBYism. 

The authors use prices and density to explore where and why new housing is built. The traditional negative relationship between density and housing construction has weakened, or in some cases, reversed in recent decades. The results show that housing supply growth has slowed significantly in low-density areas, particularly in the areas with higher home prices, where much of the housing expansion would traditionally have been expected. This shift reflects the growing impact of regulatory barriers, as suburban and low-density areas now face stricter zoning, and longer permitting processes. These factors make building more homes more difficult and less responsive to demands or market signals. 

The striking finding of this new analysis is that the traditional engine of home building in the South is weakening. The South has had stronger population growth and lower regulatory barriers to land development and home construction than most of the rest of the country.  But as incomes have increased, the authors claim that regulatory barriers have increased, slowing this once fast-growing region. 

Despite the higher home prices, builders face challenges, including higher interest rates, rising inflations, lot and labor shortages, and regulations, that prevent them from building more new homes. According to NAHB’s estimates, based on 2021 data, the U.S. needs 1.5 million additional units to fill the housing shortage gap. In short, the combination of regulatory barriers and economic headwinds continues to hamper housing production nationwide and these challenges are expanding to regions of the country that were once less affected. 

Discover more from Eye On Housing

Subscribe to get the latest posts sent to your email.


This article was originally published by a eyeonhousing.org . Read the Original article here. .


Remote work may no longer dominate the U.S. labor force as it did during the height of the pandemic in 2020, but it still represents a substantial share of employment today. According to the latest data from the Current Population Survey (CPS), approximately 34.3 million employed people teleworked or worked at home for pay in April 2025. The telework rate, which represents the number of people who teleworked as a percentage of people who were working, was 21.6% in April, and it has consistently ranged between 17.9% and 23.8% between October 2022 and April 2025.

Of those who teleworked in April, more than half teleworked for all their working hours, while the remaining teleworked for some, but not all, of their work hours.

The distribution of telework across the U.S. workforce continues to reflect deeper patterns shaped by gender, age, education, occupation, and industry. The following insights are based on an analysis of monthly CPS data.

Gender: Women Lead in Telework

Women continue to outpace men in remote work participation.

Nearly 25% of employed women worked from home in April 2025.

In contrast, about 19% of employed men teleworked.

This gender gap reflects employment trends. Many women are employed in professional, administrative, or office-based roles. These fields transitioned smoothly to remote work during the pandemic and have largely maintained hybrid or fully remote options. Additionally, the growing rate of college completion among women1 has pushed more women into positions that are structurally suited to telework. Flexibility remains a priority, especially for women balancing work and caregiving responsibilities, further reinforcing the demand for work-from-home arrangements.

Age: Older Workers Are More Likely to Telework

Age also plays a major role in who works remotely. Workers aged 25 and older are more likely to telework than their younger counterparts.

Ages 16–24: Only 6.2% worked from home.

Ages 25–54: About 24% reported teleworking.

Ages 55+: Around 23% worked remotely.

Younger workers tend to fill entry-level roles in retail, hospitality, and service sectors that require in-person attendance. Meanwhile, older workers are more likely to have progressed in their careers into managerial or specialized roles where remote work is feasible or even expected.

Education: Higher Degrees, Higher Telework Rates

Education remains one of the strongest indicators of telework status. Higher educational attainment is positively associated with a higher telework rate.

No high school diploma: Just 3.1% worked remotely.

High school graduates, no college: 8.4% teleworked.

Some college or associate degree: 17.3% reported working from home.

Bachelor’s degree or higher: 38.3% worked remotely.

Higher educational attainment often leads to employment in knowledge-based sectors such as finance, information technology, consulting, and research. These roles often depend on digital communication tools and independent project-based tasks, making them well-suited for remote settings.

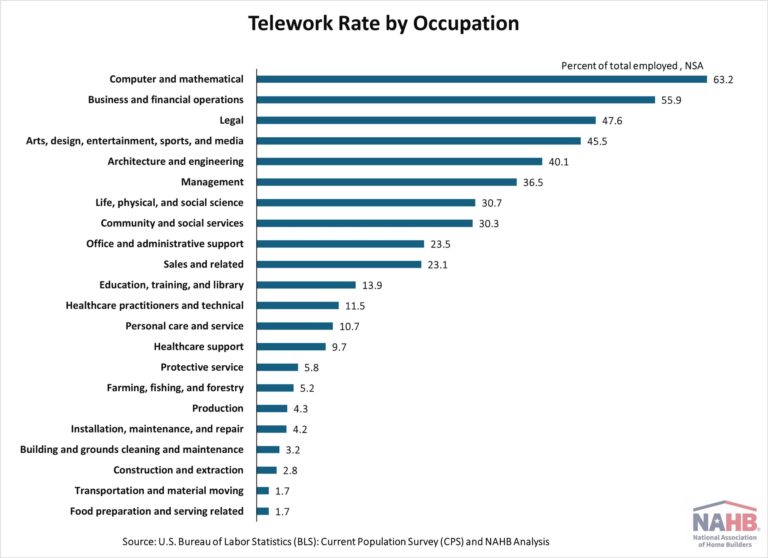
Occupation: Business and Financial Operations, and Professionals Dominate Remote Work

Not surprisingly, occupation heavily influences access to teleworking. Jobs that require physical presence, such as those in food service, transportation, manufacturing, and construction, naturally offer limited remote opportunities. In contrast, people employed in professional and technical fields report the highest telework rate, especially those working in computer and mathematical roles.

Industry trends mirror these occupational divisions. Certain sectors have fully embraced telework, particularly finance, information services, and professional and business services. These industries often prioritize flexibility and are structured in ways that make remote work not only possible but efficient. On the other hand, industries like construction, leisure and hospitality remain firmly grounded in physical spaces and in-person involvement. In these fields, work is inherently tied to locations and equipment that cannot be replicated remotely. The construction industry had a telework rate of just 9.8% in April, and leisure and hospitality reported an even lower rate of 8.1%.

Looking Ahead:

Remote work is not disappearing; it is evolving. The opportunity to work from home is increasingly concentrated among individuals with higher education levels, white-collar job titles, and positions in tech-driven or office-based industries. Meanwhile, those who are younger, have less educational attainments, or work in manual or service-based roles remain largely tied to traditional, in-person work.

For the future, we don’t know if telework will expand to become more inclusive or continue reinforcing existing divides in education and job roles. For now, the data suggests that remote work is here to stay, but only for some.

Note:

“U.S. women are outpacing men in college completion, including in every major racial and ethnic group”, Pew Research Center.

Connor Borkowski and Rifat Kaynas, “Telework trends,” Beyond the Numbers: Employment & Unemployment, vol. 14, no. 2 (U.S. Bureau of Labor Statistics, March 2025),

Discover more from Eye On Housing

Subscribe to get the latest posts sent to your email.


This article was originally published by a eyeonhousing.org . Read the Original article here. .
Pin It