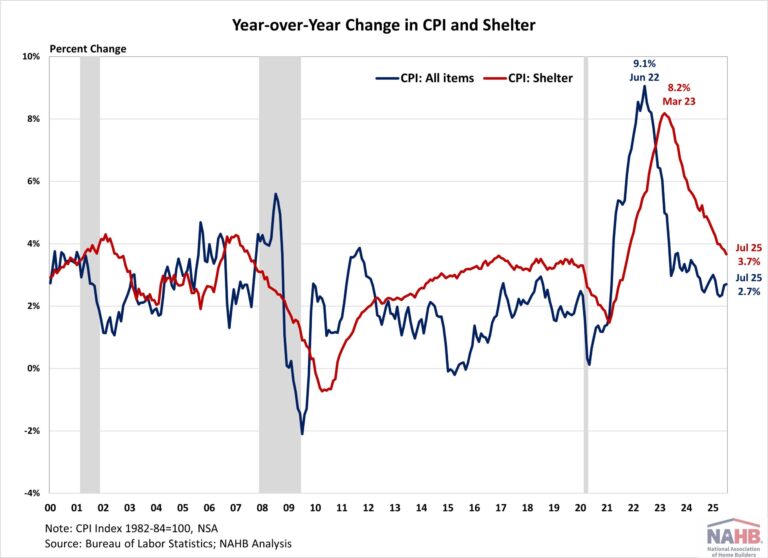
Inflation held steady at 2.7% in July as food an energy prices remained subdued and offset increases in service prices, according to the Bureau of Labor Statistics’ (BLS) latest report. Core inflation, which exclude volatile food and energy, picked up to its largest monthly increase since January and fastest annual pace since February. Meanwhile, housing inflation continued to show signs of cooling, matching the lowest level since October 2021.
Despite the modest overall increase, concerns over inflation data quality continue to grow as BLS revealed more details about data collection challenges. BLS reduced its CPI collection sample starting in April due to staffing shortages, suspending data collection in Lincoln (NE), Provo (UT), and Buffalo (NY). It also suspended collection on 15% of the sample in 72 other areas on average. When prices are unavailable, BLS uses different cell imputation, and this share jumped to 35% in June from 30% in May and just 8% in June 2024.
During the past twelve months, on a non-seasonally adjusted basis, the Consumer Price Index rose by 2.7% in July, unchanged from June and the highest since February 2025. Excluding the volatile food and energy components, the “core” CPI increased by 3.1% over the past twelve months. A large portion of the “core” CPI is the housing shelter index, which increased 3.7% over the year, the lowest reading since October 2021. Meanwhile, the component index of food rose by 2.9%, and the energy component index fell by 1.6%.
On a monthly basis, the CPI rose by 0.2% in July (seasonally adjusted), after a 0.3% increase in June. The “core” CPI increased by 0.3% in July.
The price index for a broad set of energy sources fell by 1.1% in July, with increases in fuel oil (+1.8%) offset by declines in gasoline (-2.2%), natural gas (-0.9%) and electricity (-0.1%). Meanwhile, the food index was unchanged, after a 0.3% increase in June. The index for food away from home increased by 0.3% while the index for food at home fell by 0.1%.
The index for shelter (+0.2%) continued to be the largest contributor to the monthly increase in all items index. Other top contributors that rose in July include indexes for medical care (+3.5%), airline fares (+4.0%), recreation (+0.4%), household furnishings and operation (+3.4%), as well as used cars and trucks (+0.5%). Meanwhile, the index for lodging away from home (-1.0%) and communication (-0.3%) were among the few major indexes that decreased over the month. The index for shelter makes up more than 40% of the “core” CPI, rising by 0.2% in July, following the same increase last month. The index for owners’ equivalent rent (OER) and for rent of primary residence (RPR) both increased by 0.3% over the month. Despite the moderation, shelter costs remained the largest contributors to headline inflation.
NAHB constructs a “real” rent index to indicate whether inflation in rents is faster or slower than core inflation. It provides insight into the supply and demand conditions for rental housing. When inflation in rents is rising faster than core inflation, the real rent index rises and vice versa. The real rent index is calculated by dividing the price index for rent by the core CPI (to exclude the volatile food and energy components).
In July, the Real Rent Index fell by 0.1%. Over the first seven months of 2025, the average monthly growth rate held steady at 0.1%, unchanged from the same period in 2024.
Discover more from Eye On Housing
Subscribe to get the latest posts sent to your email.
This article was originally published by a eyeonhousing.org . Read the Original article here. .

