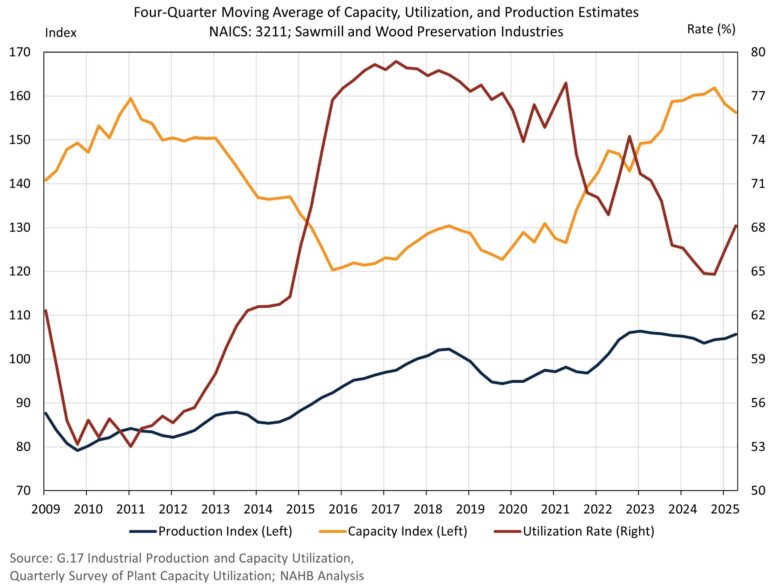
Sawmill production has remained essentially flat over the past two years, according to the Federal Reserve G.17 Industrial Production report. This most recent data release contained an annual revision, which resulted in higher estimates for both production and capacity in U.S. sawmills. While in previous analysis, production had remained stagnant since 2017; this revision shows current levels above 2017 by 7.5%. This revision also leads to an increased production capacity estimate, now peaking in the fourth quarter of 2024, and exceeding the capacity level seen in the early 2010s.
The sawmill utilization rate is a ratio of actual production and potential full production that is released quarterly by the Census Bureau. The utilization rate has experienced an overall downward trend since 2017 as a result of added capacity, yet stagnant production. However, the second quarter of 2025, on a four-quarter moving average, experienced a slight uptick from 66.5% to 68.1%. Meanwhile, sawmill production, based on a four-quarter moving average, is 0.9% higher in the second quarter of 2025 compared to the first quarter. However, sawmill production remains just 0.3% above 2023 levels.
The current sawmill capacity estimate is down 1.2% from the first quarter of 2025. Despite this quarterly decline, capacity is higher than a few years ago. Compared to the second quarter of 2023, the estimate is up 4.5%. This is the expected result due to flat production over this period coupled with a declining utilization rate.
In the previous two years, especially in 2024, lumber prices experienced declines as supply outpaced demand. Lower prices have led to sawmill curtailments and closures with excess lumber capacity, which may be why the capacity index started to show declines in early 2025. Another notable trend is the continued declines in sawmill employment levels, with no strong impact on production levels. Some of this likely has to do with the technological advancements in place from new investment into sawmills resulting in fewer workers being able to produce higher levels of output.
Looking ahead, lumber production and pricing in 2026 remains highly uncertain. The latest lumber prices in December continue to remain low, despite combined duties of nearly 45% on U.S. imports of softwood lumber from Canada. Waning housing production over the course of 2025 created an environment where lumber supply was continually above demand, especially over the second half of the year. Next year, depending on residential construction, we may see lumber prices enter a period of volatility. Mills across North America have been producing at a loss for much of 2025, creating conditions where closures and curtailments potentially lead to a lower supply of lumber next year.
This article was originally published by a eyeonhousing.org . Read the Original article here. .

